Subscription: Access to Micro Counts of US indices
Nasdaq has made enough waves to consider it having topped but may stretch to 8,020
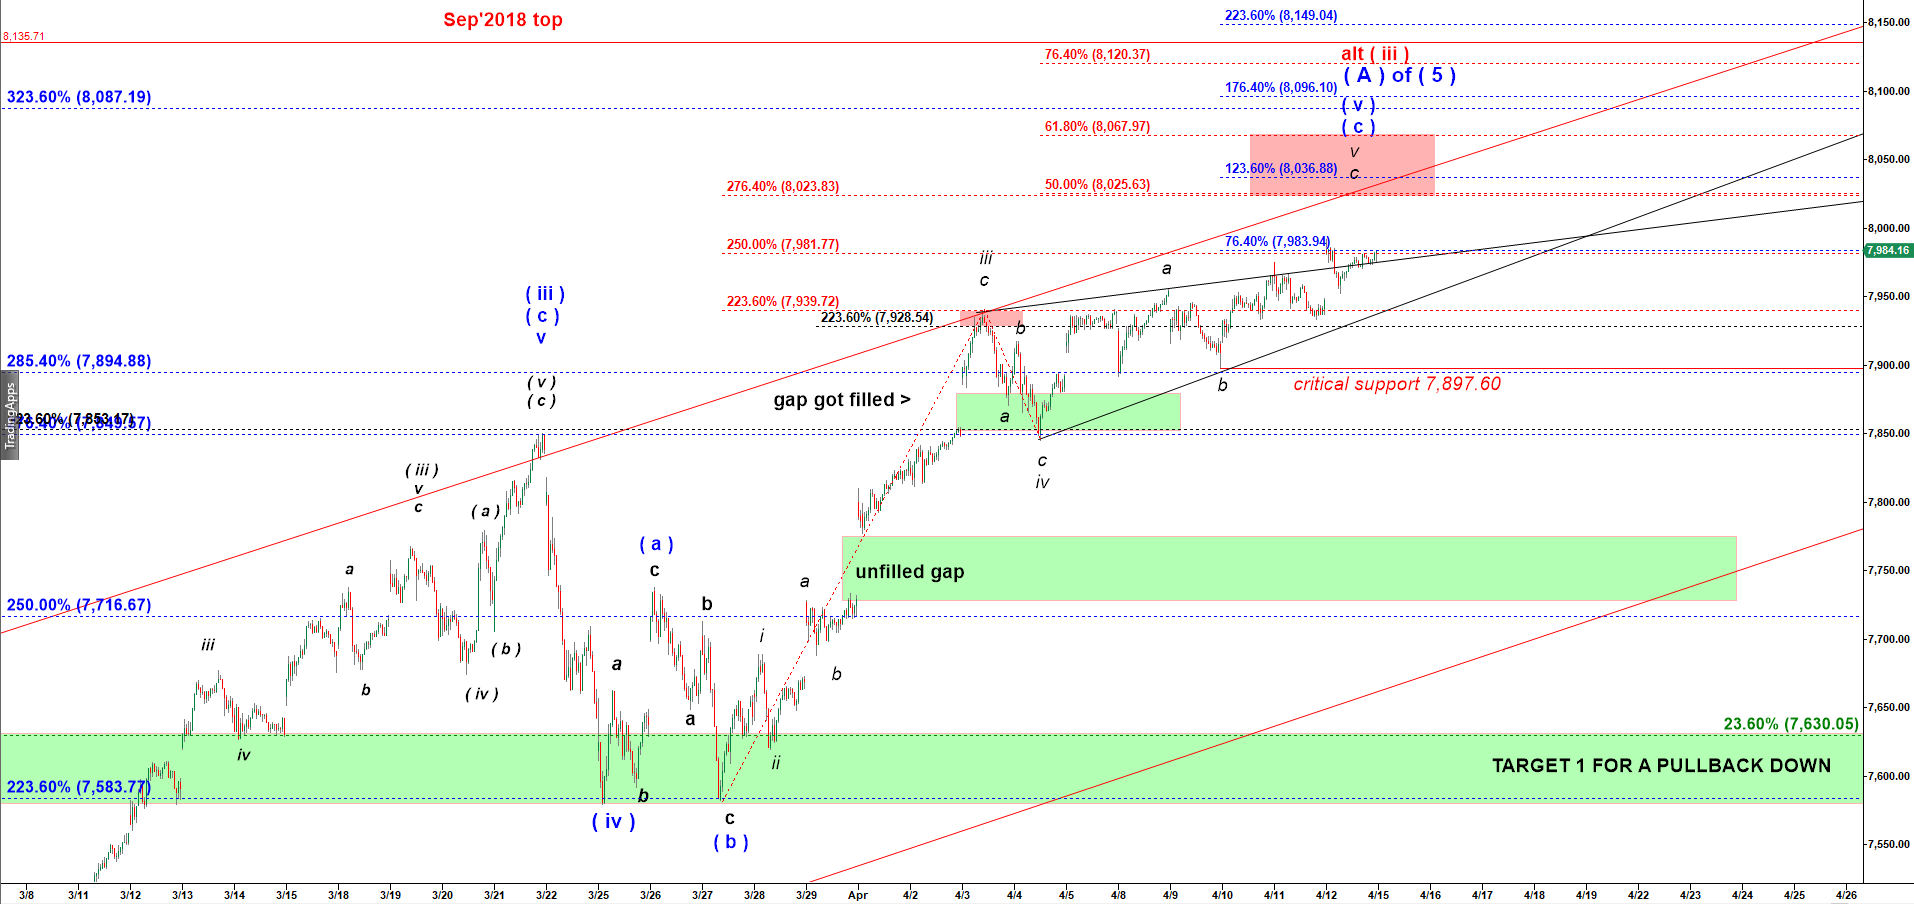
Nasdaq has played out enough waves to consider the last (a)-(b)-(c) structure (the blue labels) having completed. However, it still has not tagged my Red Target box. There is a strong confluence of fibs at 8,020 level. They can easily push it there even this Sunday night (on NQ-mini).
We still have an open question whether the rally off December 2018 low is about to complete here or what we are about to complete is only wave ( iii ) of ( A ) of ( 5 ).
Nevertheless, even if Nasdaq is only topping in wave ( iii ) of ( A ) of ( 5 ), we should get a meaningful corrective wave ( iv ) down.
There are two levels that would work as support for that coming pullback:
First, price will fill the gap up in between created on ( 7,776 and 7,734 ) on 1 Apr 2019
Second, and more importantly, price normally tends to come back and retest the low created by wave ( iv ) of a lower degree. That wave ( iv ) of a lower degree bottomed at 7,579.29 on 25 March 2019
Nasdaq Composite - 15 min chart updated at 5:25 PM on 4/14/2019