Skip to content
  • Home
  • US Market Updates
  • Indicators
    • Impulse Master
    • Cycle Trader
    • GANN Levels
    • Subscribe
  • Education
    • Beginners Video Course
    • Intermediate Video Course
      • Syllabus of the Course
    • Trading Like A Pro Video Course
    • Video Lesson of the Week
  • Chat Room
  • Pricing
  • FAQ
  • My Account
  • Login

Subscription: Micro Counts of Crude Oil & Nat Gas

NG - keeps moving along the bearish path

I can only repeat what I wrote last time:

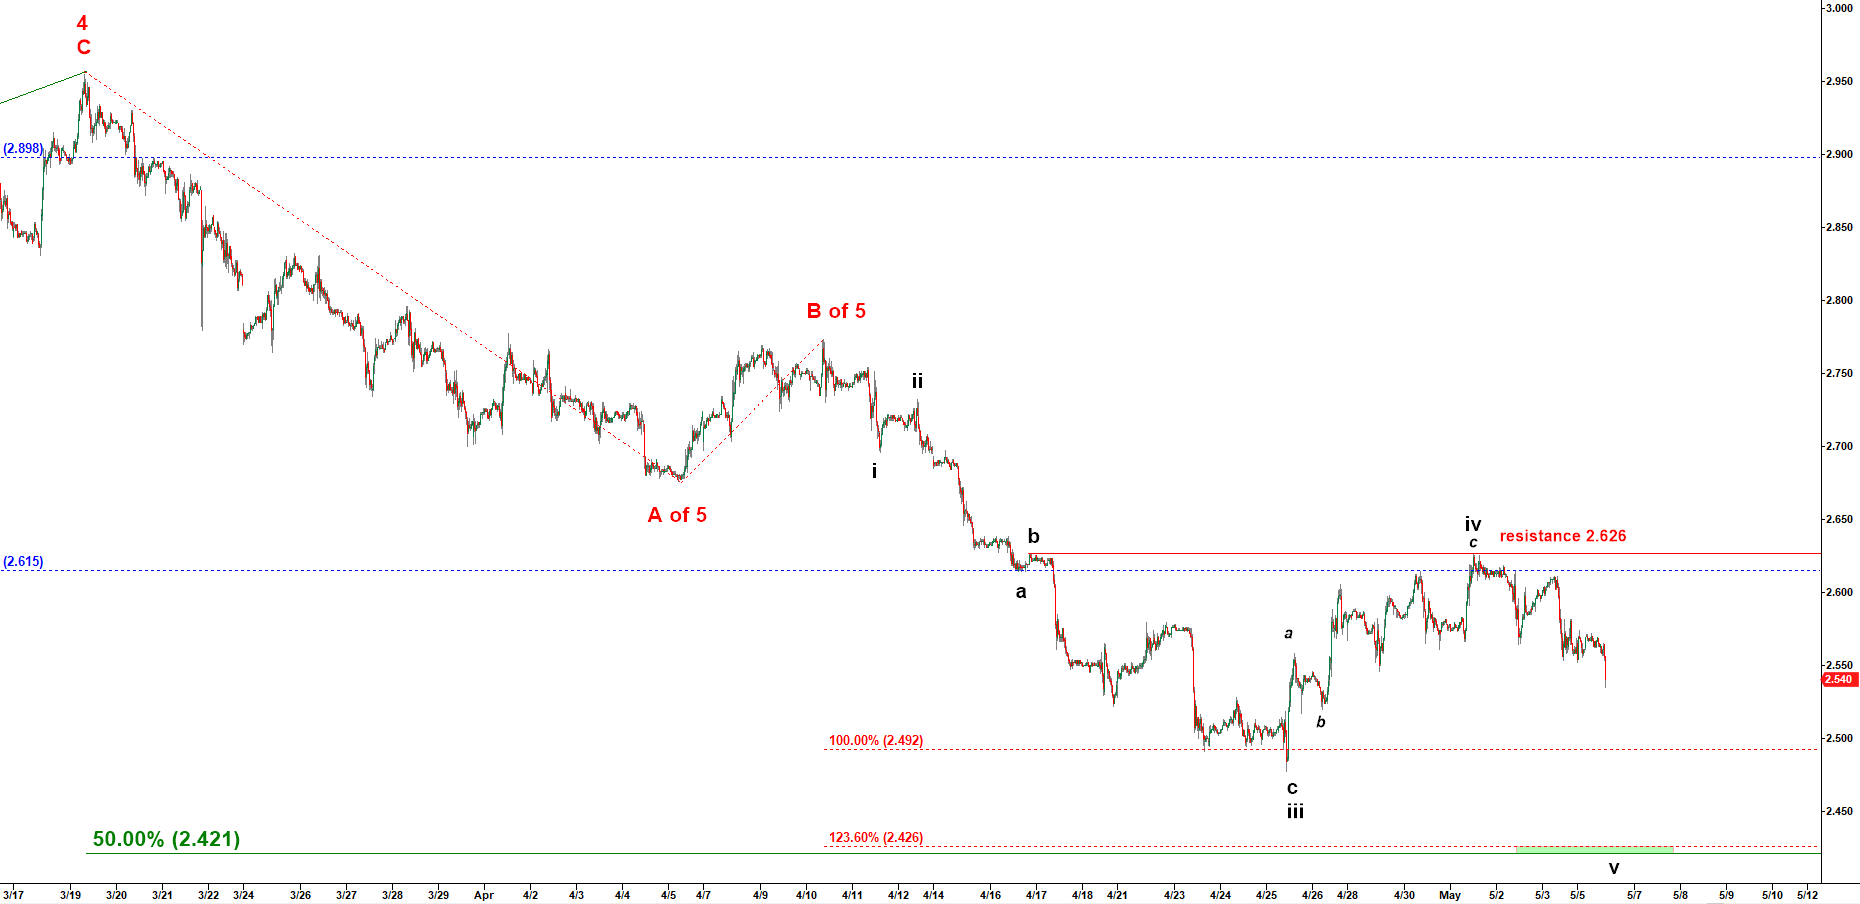
“NG keeps hanging right under the critical resistance of 2.626. As long as it stays under 2.626 I expect it to make another lower low in wave ( v ) down before a bigger bounce up.”

The minimum target for wave v down is 2.421 but it can stretch lower. To make me interested in catching this falling knife need a completed a-b-c down to a new lower low off the top of that corrective wave iv up.

Natural Gas - 30 min chart updated at 8:50 AM on 6 May 2019

Previous Updates:

No posts found.
© 2025 CastAway Trader • Built with GeneratePress