Skip to content
  • Home
  • US Market Updates
  • Indicators
    • Impulse Master
    • Cycle Trader
    • GANN Levels
    • Subscribe
  • Education
    • Beginners Video Course
    • Intermediate Video Course
      • Syllabus of the Course
    • Trading Like A Pro Video Course
    • Video Lesson of the Week
  • Chat Room
  • Pricing
  • FAQ
  • My Account
  • Login

Subscription: Micro Counts of Crude Oil & Nat Gas

NG - got closer to resistnace

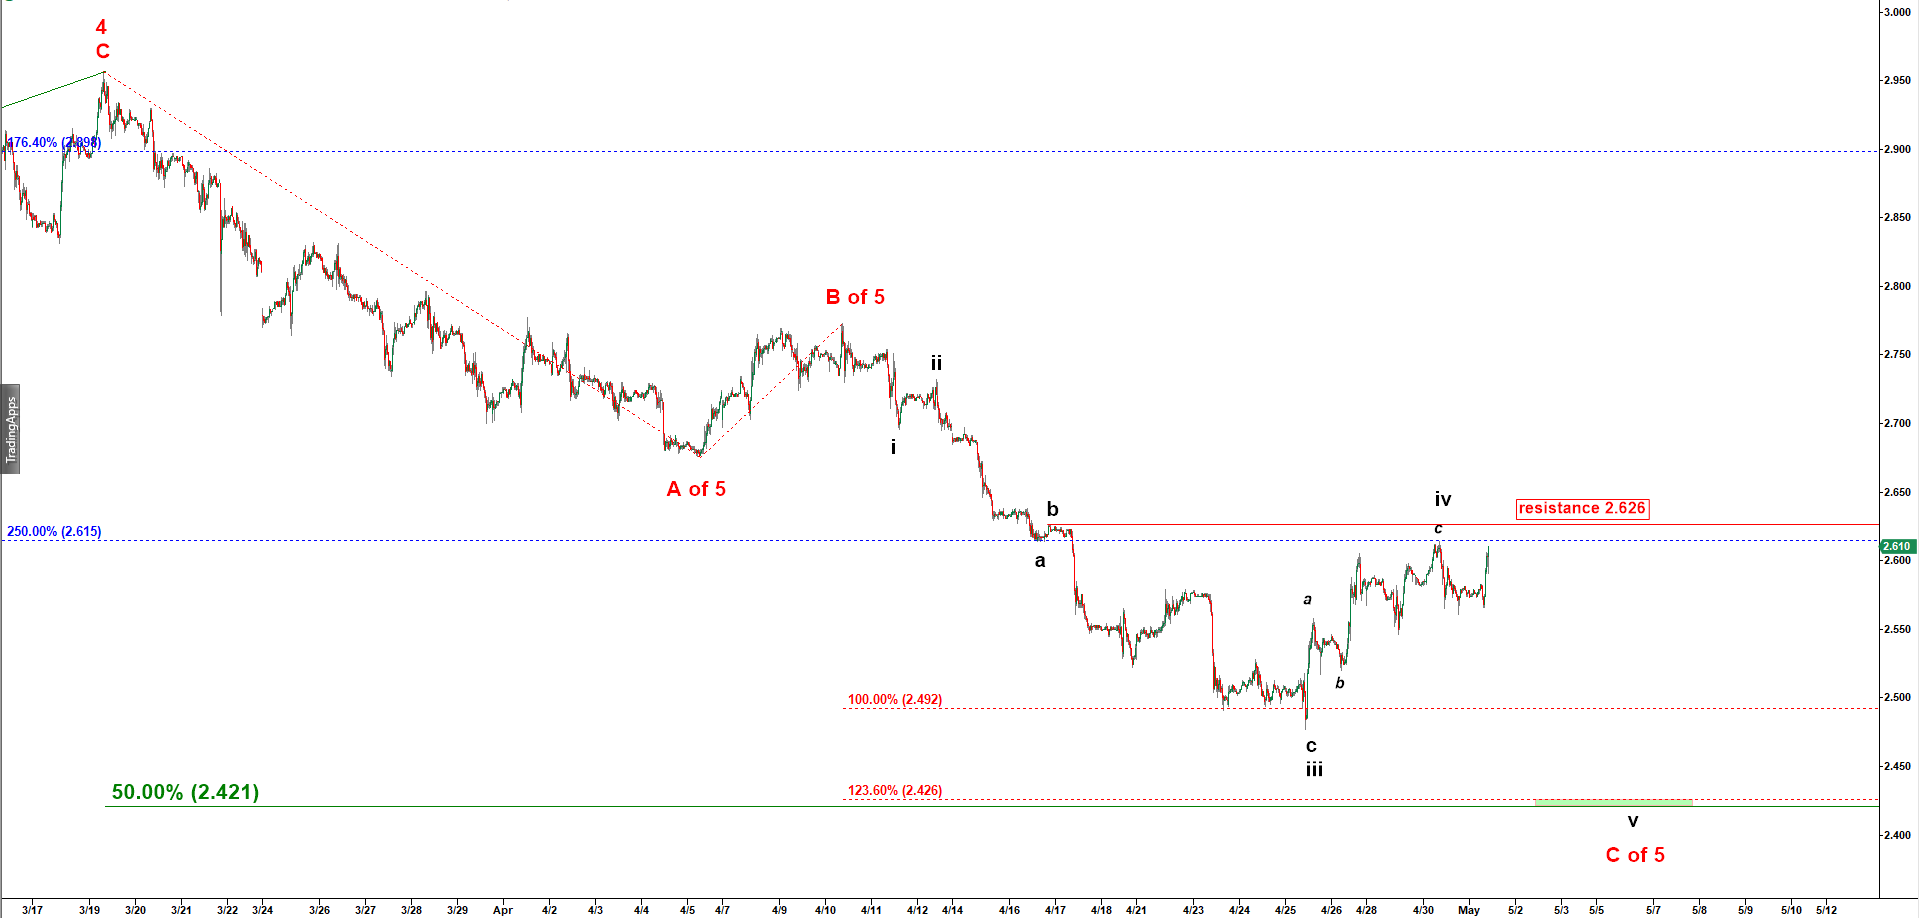
NG keeps hanging right under the critical resistance of 2.626. As long as it stays under 2.626 I expect it to make another lower low before a bigger bounce. If it manages to make a higher high that would be a bullish sign and most likely mean a bigger pullback up has started. I would not chase it because that even the bigger pullback up will be a corrective wave B up.

Natural Gas - 30 min chart updated at 9:20 AM on 1 May 2019

Previous Updates:

No posts found.
© 2025 CastAway Trader • Built with GeneratePress