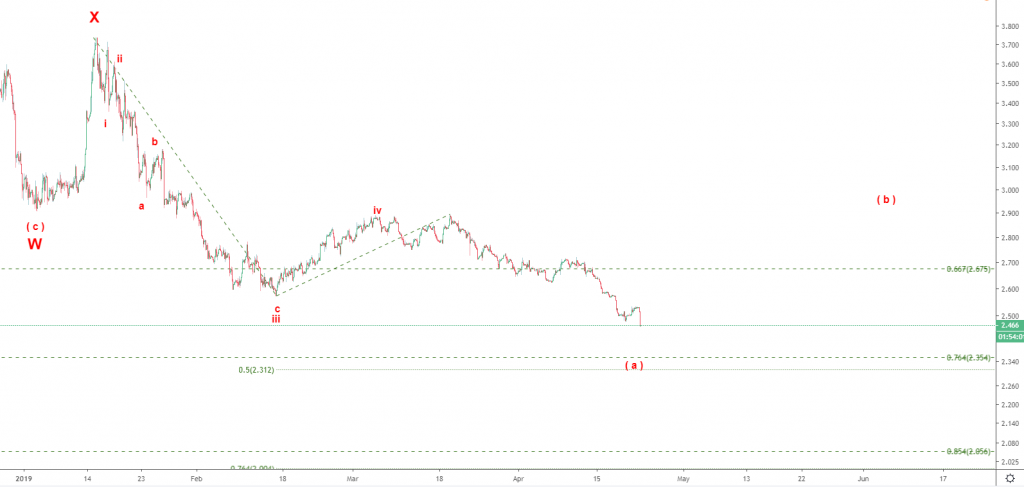
In the Macro analysis posted on 23 April 2019 the most bullish scenario I could come up with was the one shown below. It implies that we are going to get a pullback in wave ( b ) up as soon as this decline in wave ( a ) down gets completed. Let’s zoom-in to 1 hour chart to see where that wave labelled as red ( a ) down can bottom.
Natural Gas - 2 hour chart updated on 23 April 2019
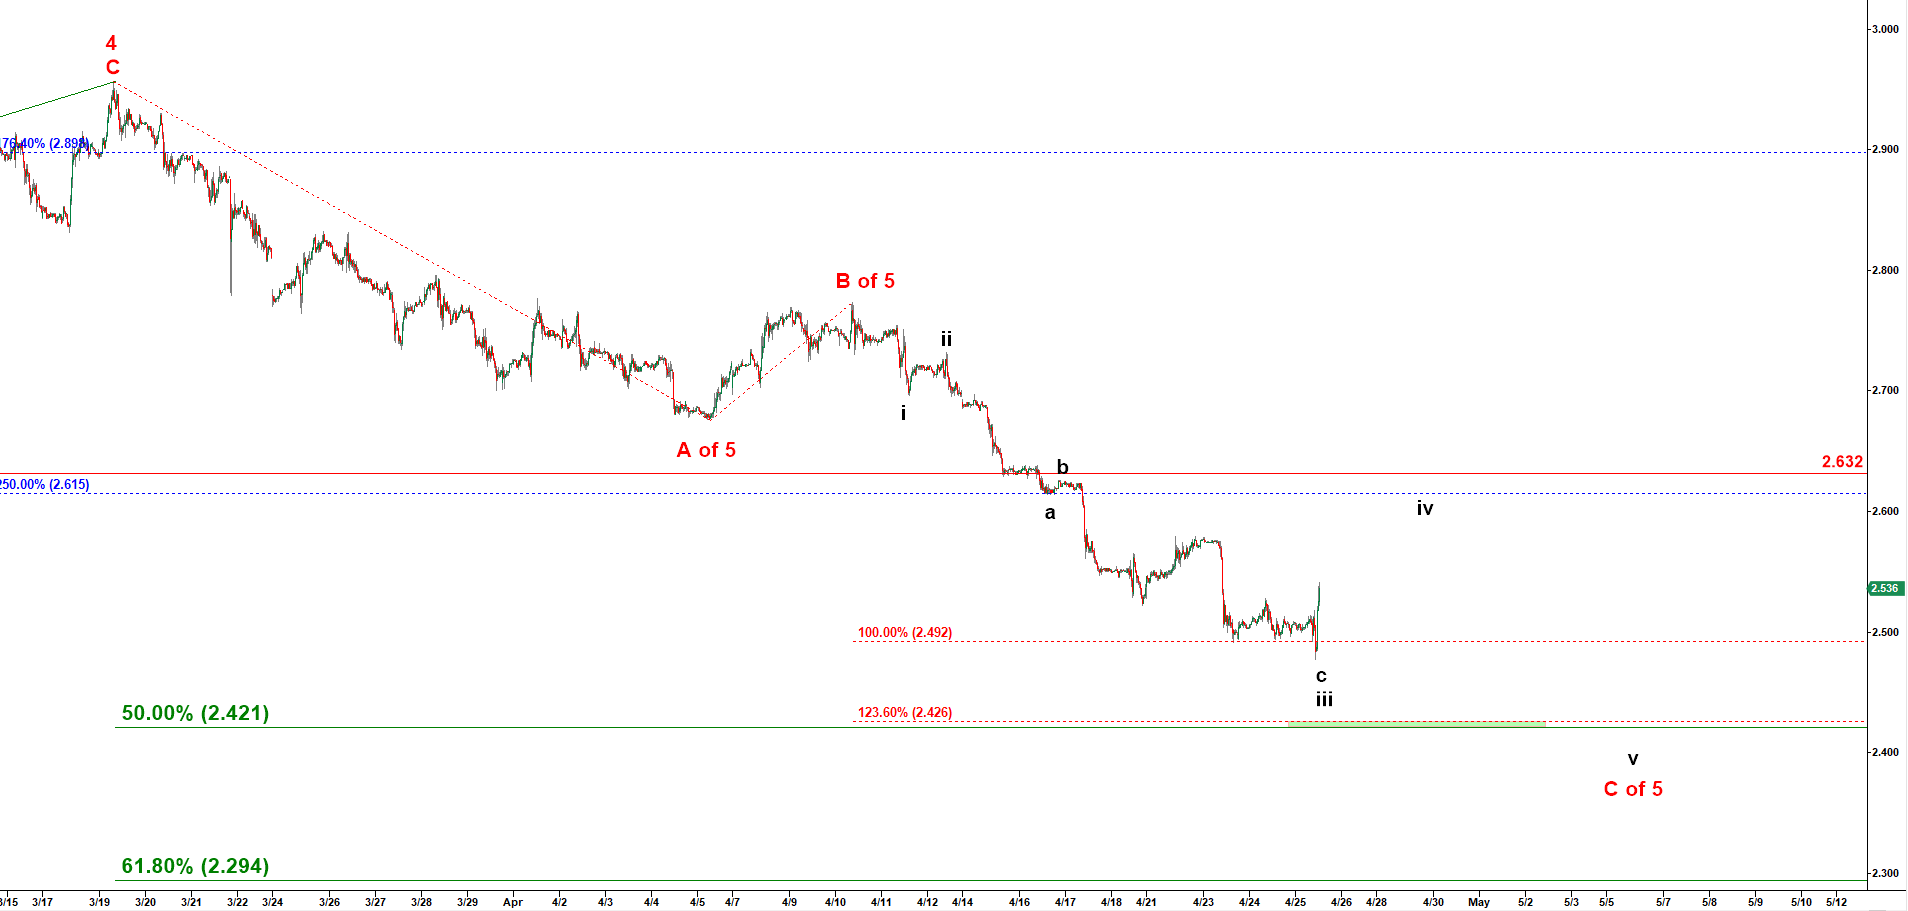
In theprevious update I counted the low as a completion of wave iii and expected that the pullback in a corrective wave iv up may go higher.
Natural Gas - 30 min chart updated at 12:00 PM on 25 April 2019
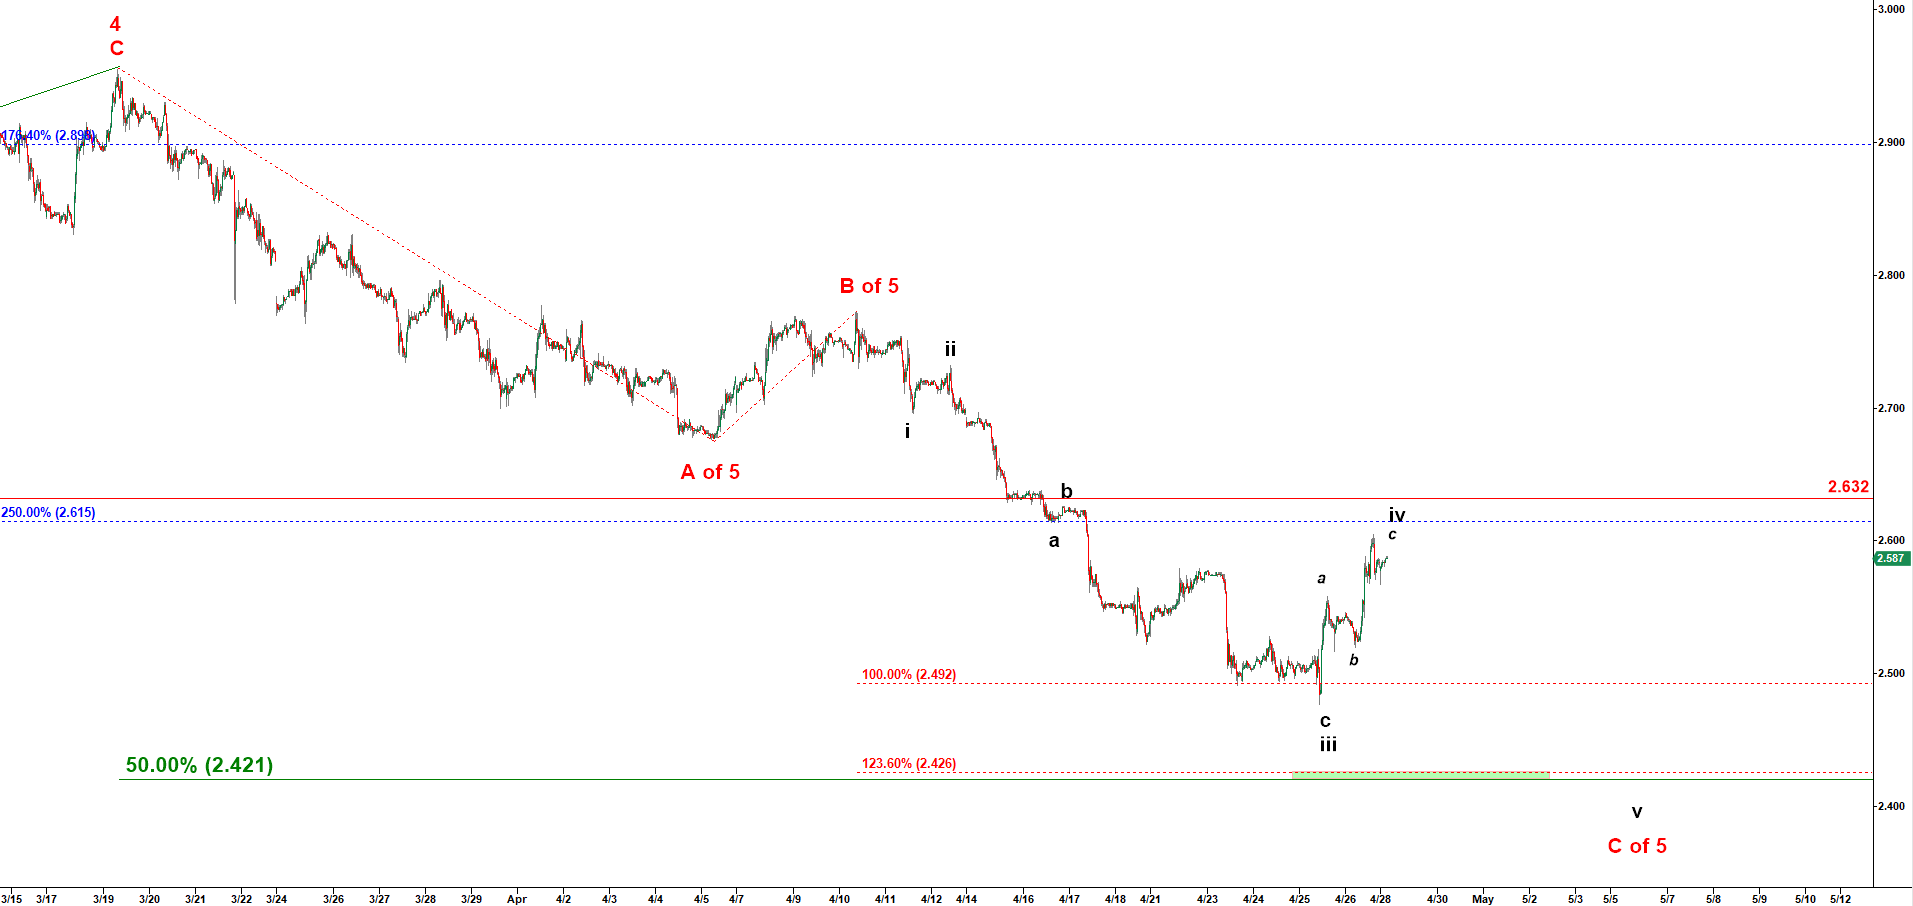
NG has a very completed a-b-c corrective structure and may start decline in the final wave v down targeting a new lower low.
Natural Gas - 30 min chart updated at 9:50 PM on 28 April 2019