Skip to content
  • Home
  • US Market Updates
  • Indicators
    • Impulse Master
    • Cycle Trader
    • GANN Levels
    • Subscribe
  • Education
    • Beginners Video Course
    • Intermediate Video Course
      • Syllabus of the Course
    • Trading Like A Pro Video Course
    • Video Lesson of the Week
  • Chat Room
  • Pricing
  • FAQ
  • My Account
  • Login

Subscription: Micro Counts of Crude Oil & Nat Gas

Crude Oil - may extend to 67.20

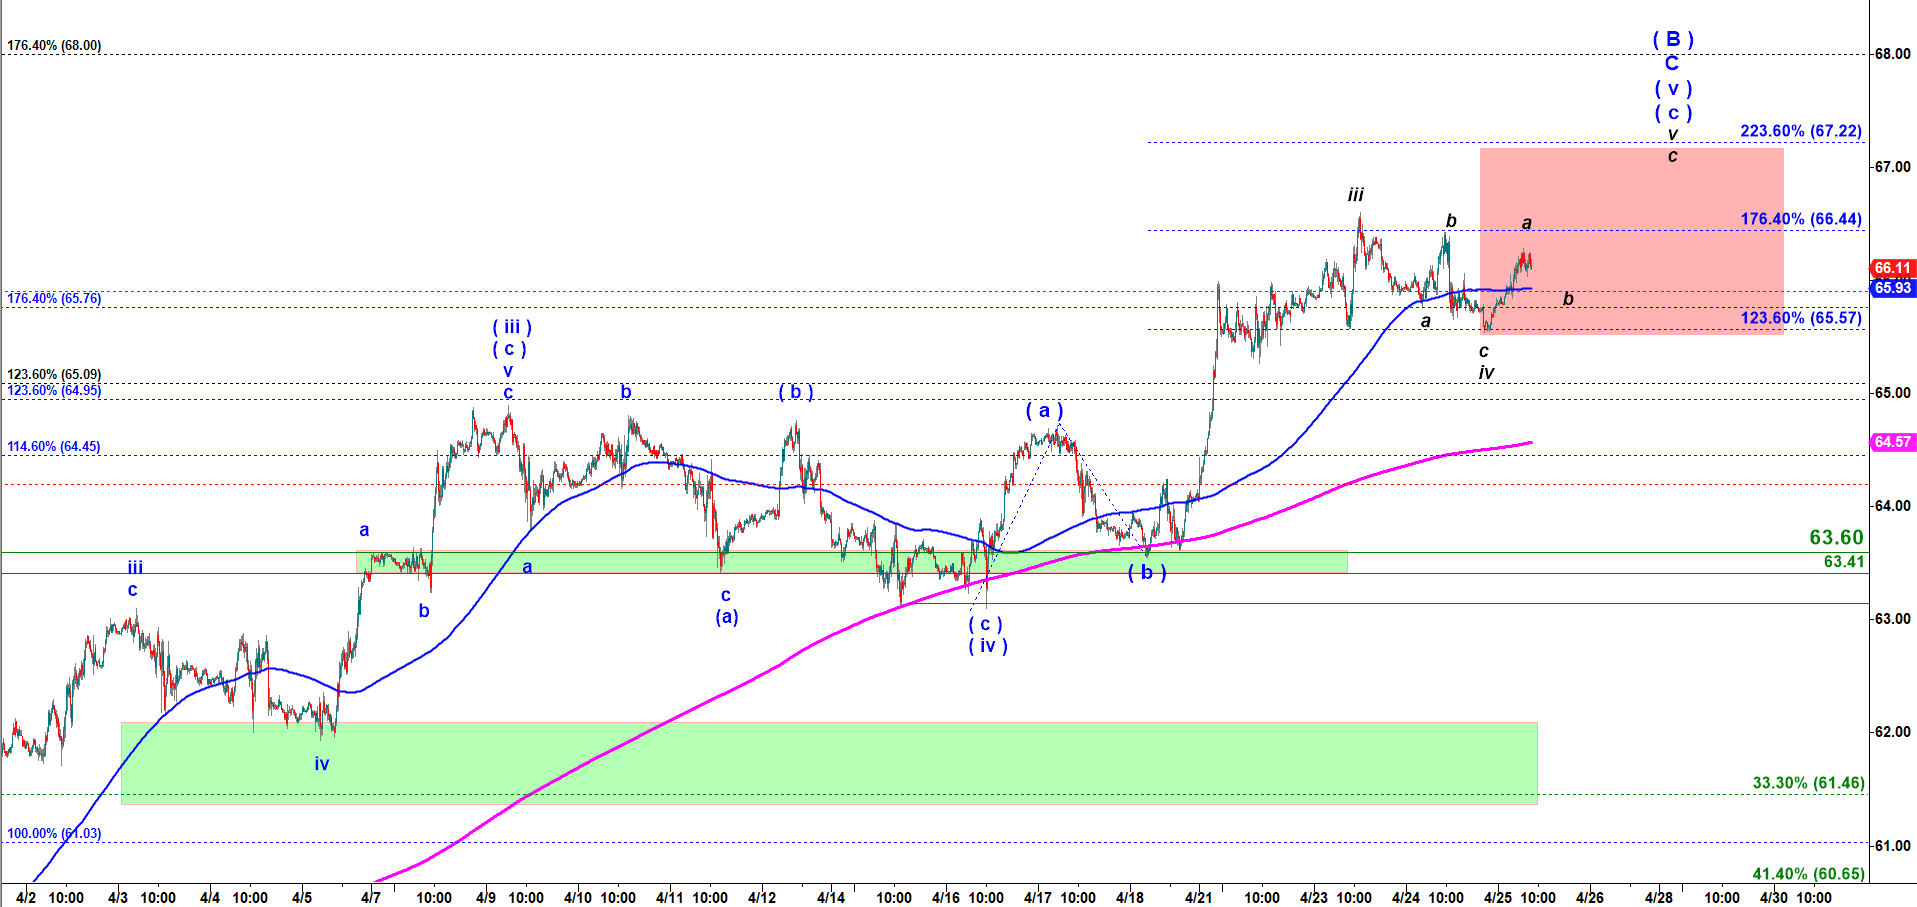
I am adding this 15 min chart to see what is happening on a micro scale with that wave ( c ) of ( v ) which is supposed to complete the rally. That wave ( c ) of ( v ) up (the blue labels) has to be structured as the Five Wave fractal so it makes sense to focus on its micro structure (the black labels).

As long as crude stays above 65.50 it may make another push higher to 67.20sh in wave c of v.

Crude Oil - 15 min chart updated at 11:00 AM on 4/24/2019

Previous Updates:

No posts found.
© 2025 CastAway Trader • Built with GeneratePress