Crude oil - expecting a corrective ( b ) up followed by a strong drop in wave ( c ) of ( iv ) down
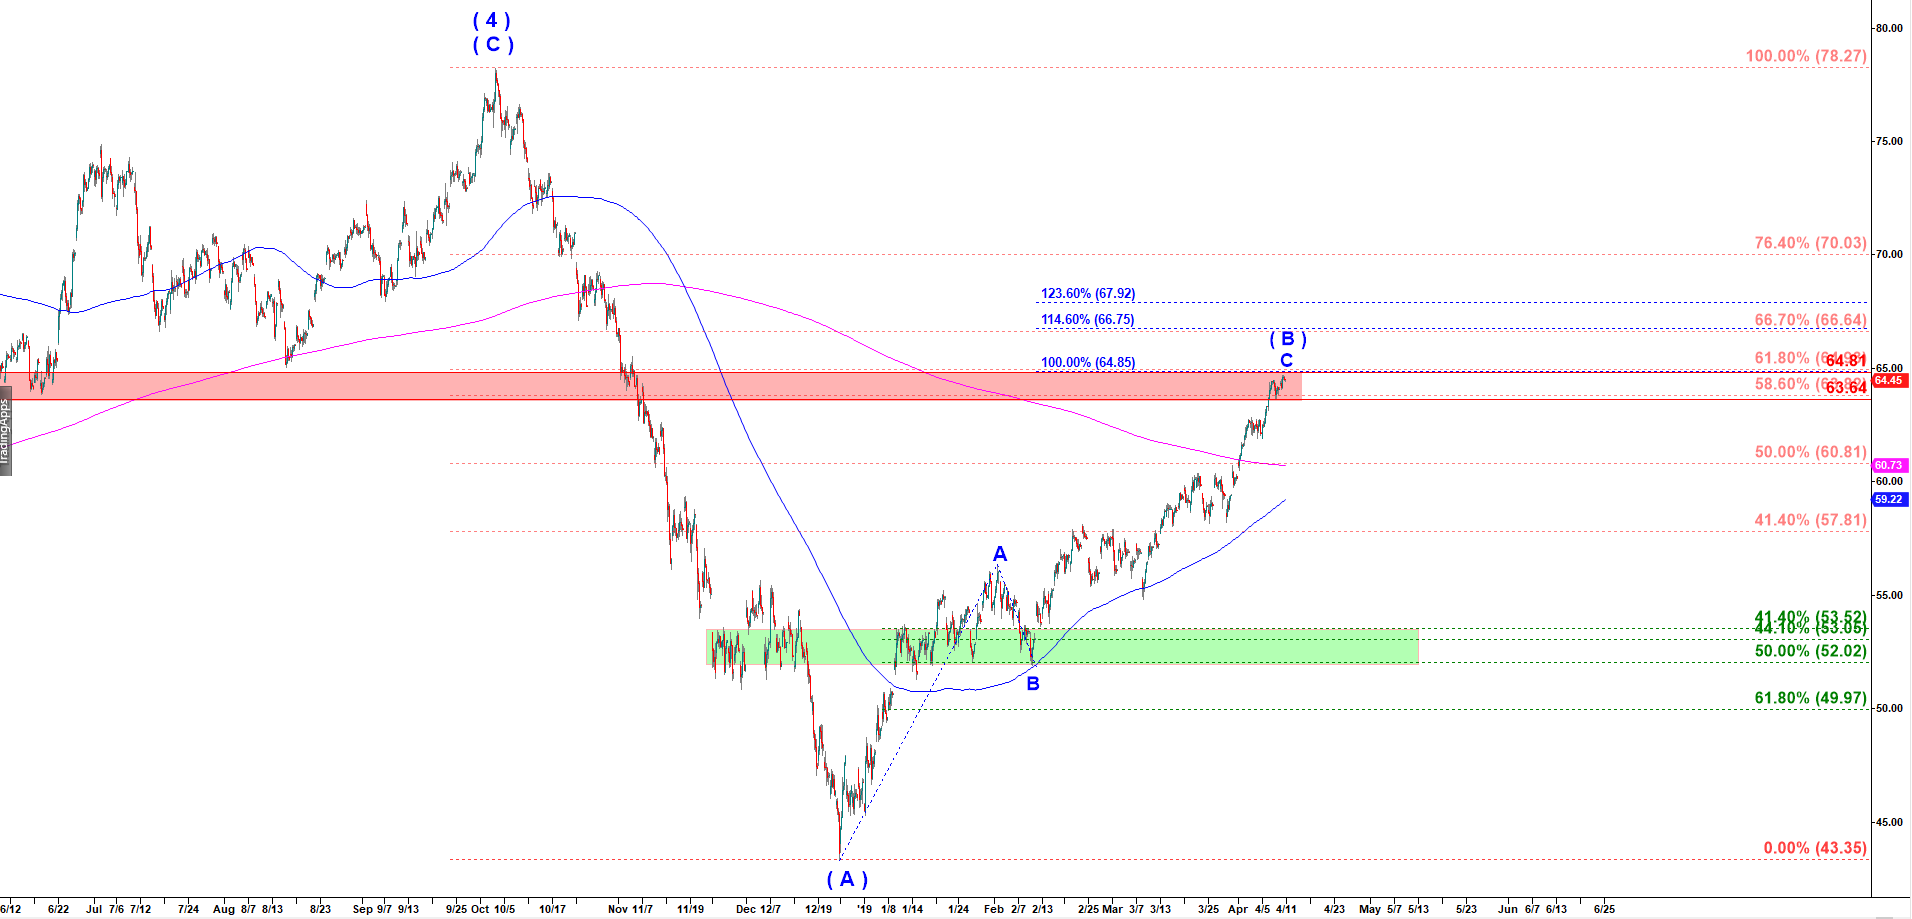
First I want to remind you that I count the rally off December 2018 low as a corrective A-B-C up. You can checkthe previous post dated 10 April 2019. That corrective rally is a wave ( B ) up that should follow by a strong decline in wave ( C ) of ( 5 ) down.
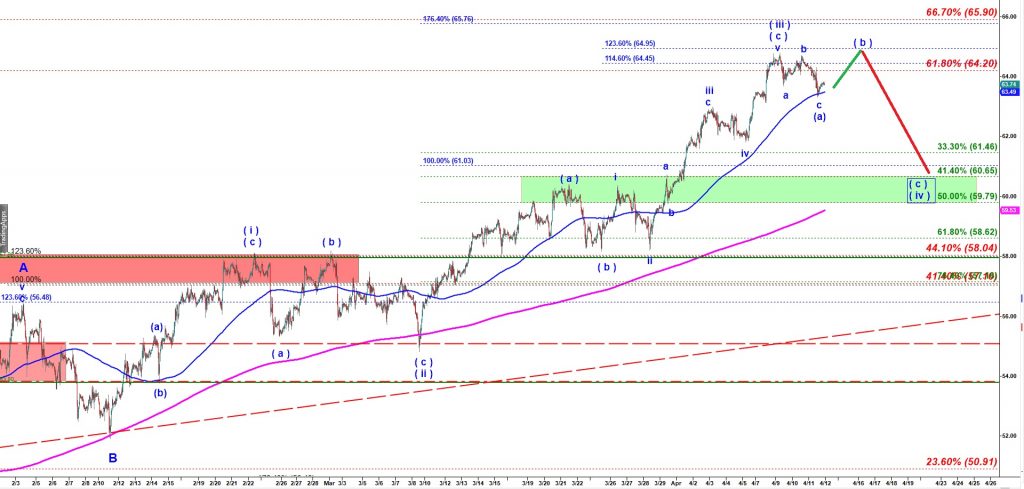
Crude oil - 90 min chart updated on 4/10/2019
As you can see on the chart below, I count the top at 64.79 reached on 9 April as the top of the wave ( iii ) up. The initial bearish a-b-c down I count as only the first leg down in wave e( a ) down. After a pullback in corrective wave ( b ) up we should get a stronger decline in wave ( c ) of ( iv ). That drop in the wave ( c ) of ( iv ) may target $61.48 – $60.65 or even $59.80. After that corrective (a)-(b)-(c) move down in wave ( iv ) we should get another rally in wave ( v ) up targeting new higher highs and completing the whole rally started in December 2018.
Crude Oil - 45 min chart updated at 12:04 PM on 4/12/2019