• Home
  • US Market Updates
  • Education
    • Beginners Video Course
    • Intermediate Video Course
      • Syllabus of the Course
    • Trading Like A Pro Video Course
    • Video Lesson of the Week
  • Blog
  • Chat Room
  • Pricing
  • FAQ
Menu
  • Home
  • US Market Updates
  • Education
    • Beginners Video Course
    • Intermediate Video Course
      • Syllabus of the Course
    • Trading Like A Pro Video Course
    • Video Lesson of the Week
  • Blog
  • Chat Room
  • Pricing
  • FAQ

Crude - still in a corrective wave ( b ) up

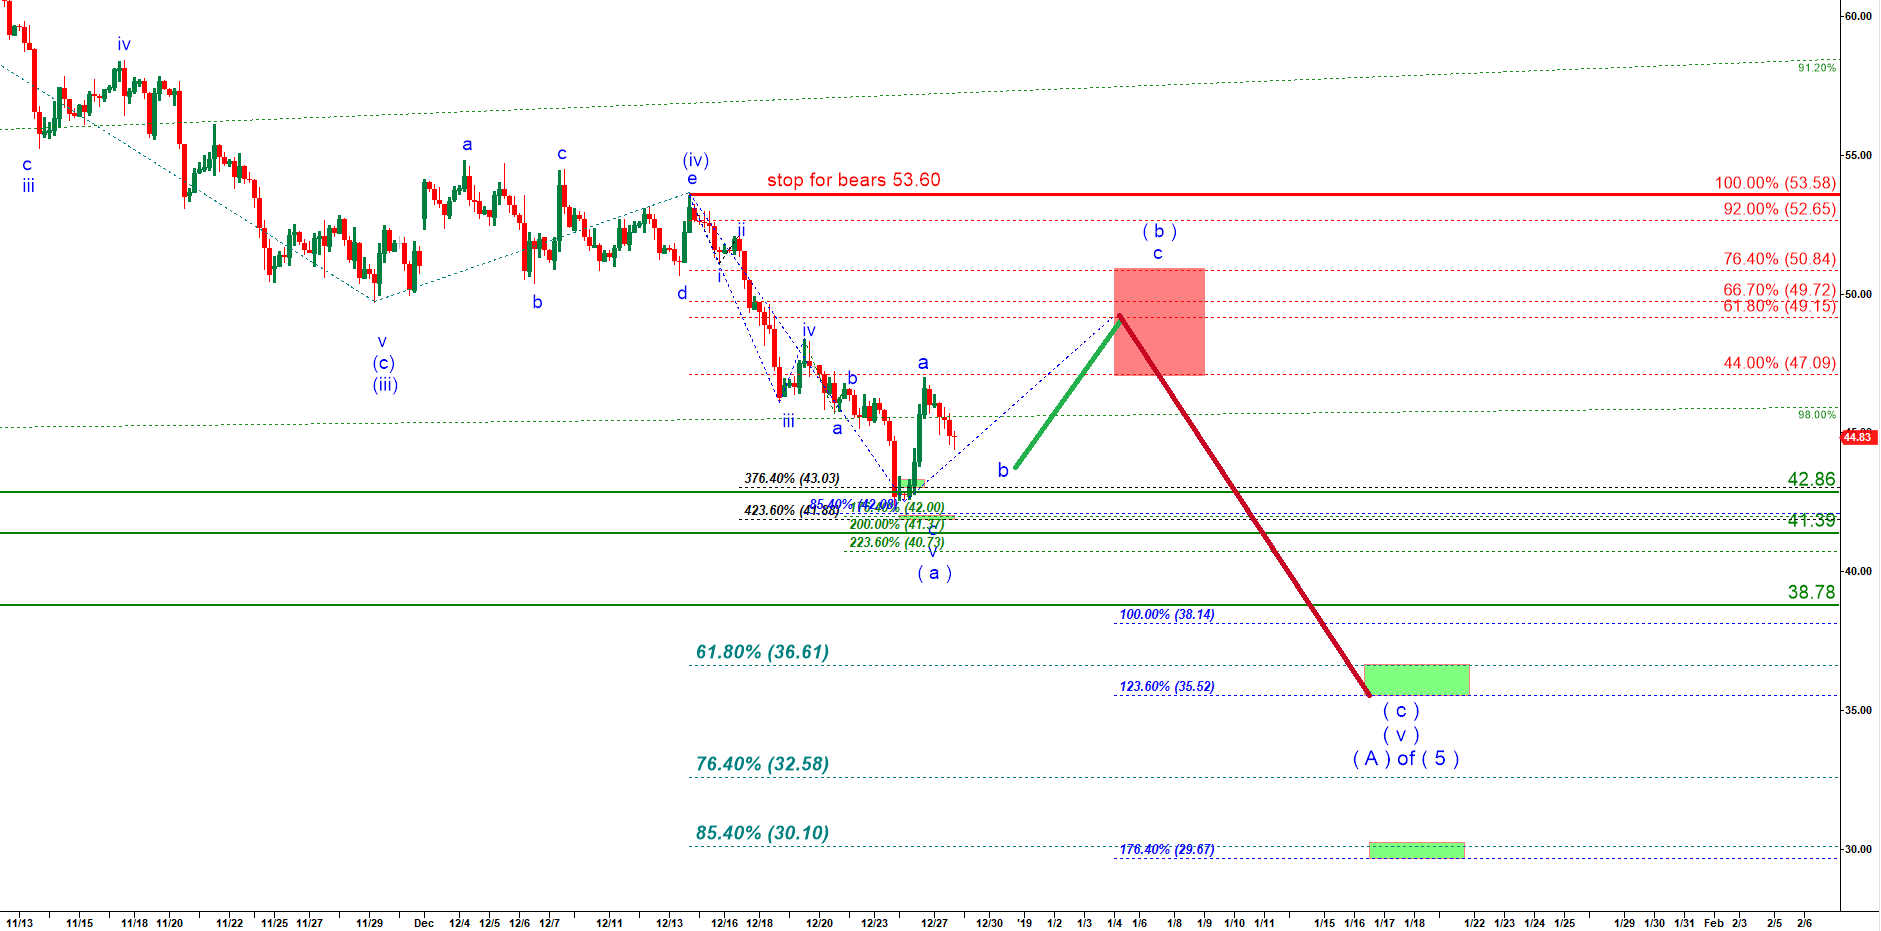
I still think that this wave ( b ) up should get higher into the red target box. We may count rally esterday as subwave a of ( b ) and the pullback today as wave b of ( b ). So we are left with one more micro rally in wave c of ( b ).

From the top of wave ( b ) up I expect another impulsive decline targeting the green box on my chart below. As long as we stay under 53.60 the structure is bearish.

Crude - 240 min chart updated on 27 December 2018

Start to learn how to predict the next market move today!
Get a promo-code for 40% discount valid until 31 Dec 2018
Tags
$ES $SPX a-b-c- up pullback a-b-c up Bearish reversal Bear Market Rally Bitcoin Bottoming Breakdown breakout Bullish Wedge Crude Oil Daily Double Three DXY ES Expanded Flat Expanding Triangle failed breakdown failed breakout Green Box Head and Shoulders i down - ii up setup Inverse Head and Shoulders i up - ii down setup Macro micro Month Opening Range NQ one more high one more higher high Red Box RTY Running Flat S&P short setup SPX topping toppying trading setup triangle Triple Three weekend Weekly YM
Read my Blog

  • My Account
  • Login
Hestia | Developed by ThemeIsle