Crude Oil - OML may only be a bottom of the first leg of the wave ( v ) down
I correctly counted the pullback off the low reached on 29 Nov 2018 as a temporary correction of the wave ( iv ) up. However, my expectations were to get a bigger correction.
Bullish Alt. Crude Oil - 45 min chart updated on 20 December 2018
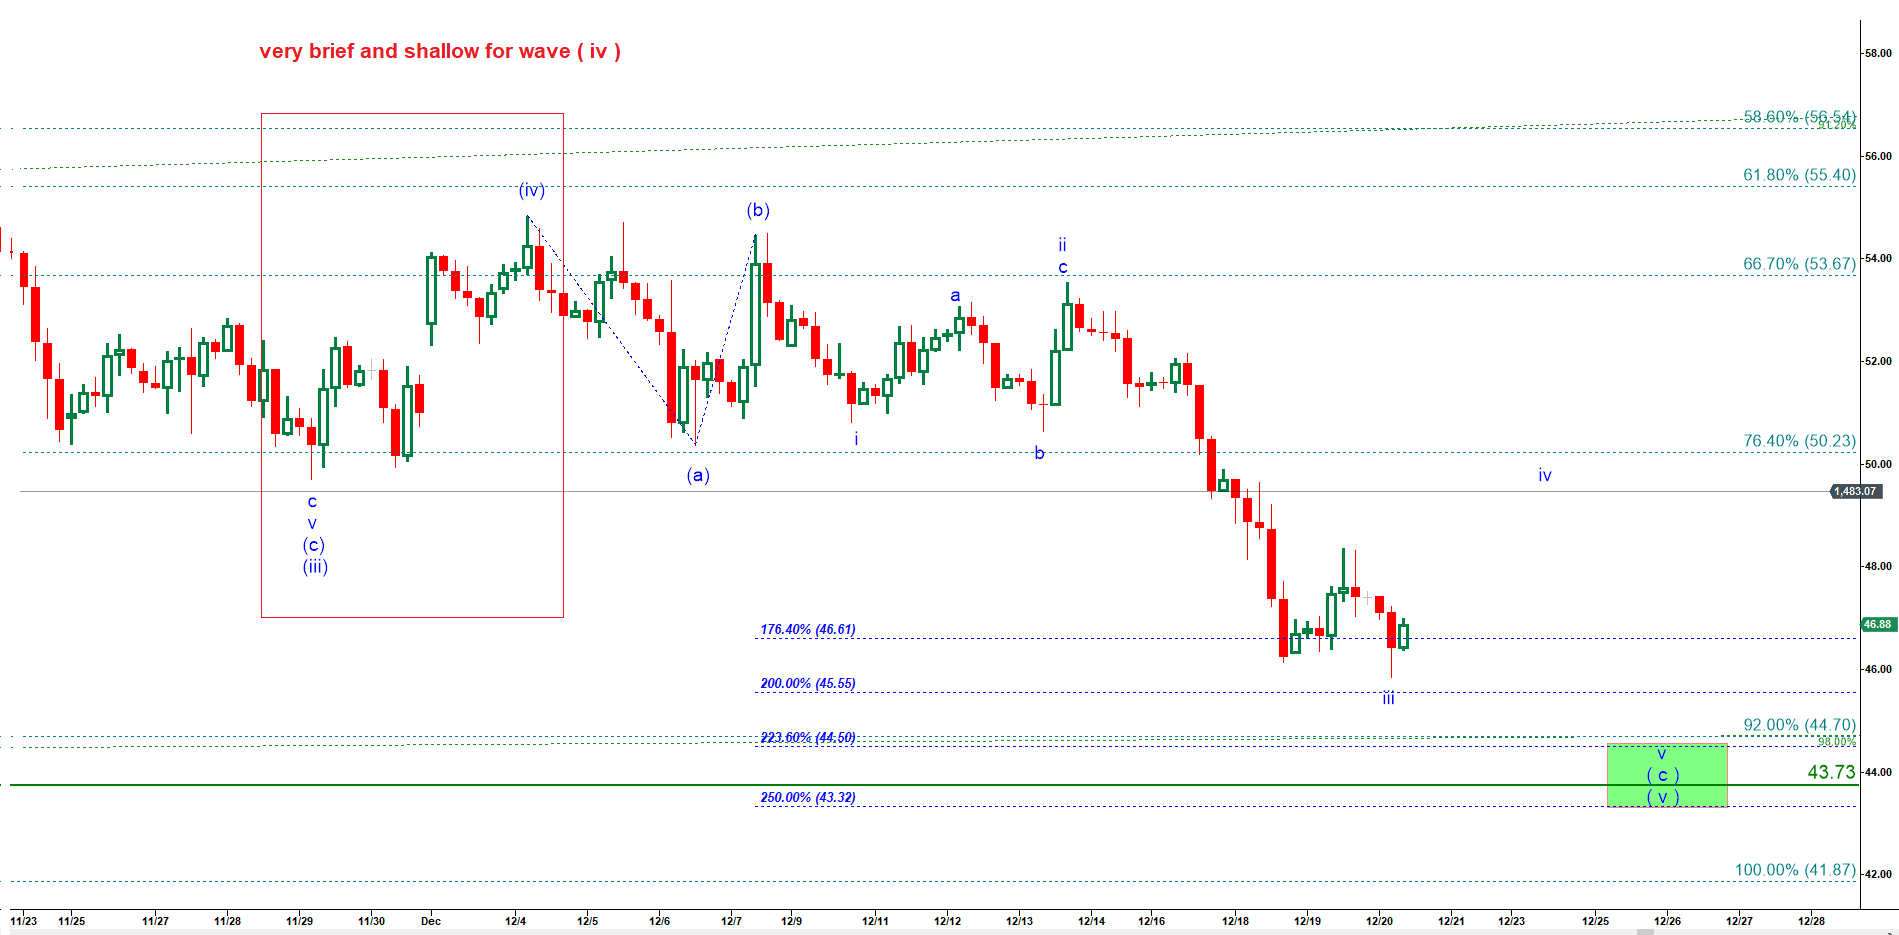
The count above does not look right because wave ( iv ) is a very shallow and very quick and it is not subdivided into three waves. We should count that formation as a triangle ( see the chart below ). If we have a very shallow correction with contracting moves the first you should check whether it follows rules of a triangle. And if I count is a triangle it is not longer a quick correction. And it is fine that was shallow because triangle is an example of a correction through time, not through price.
Bearish Alt. Crude Oil - 45 min chart updated on 20 December 2018
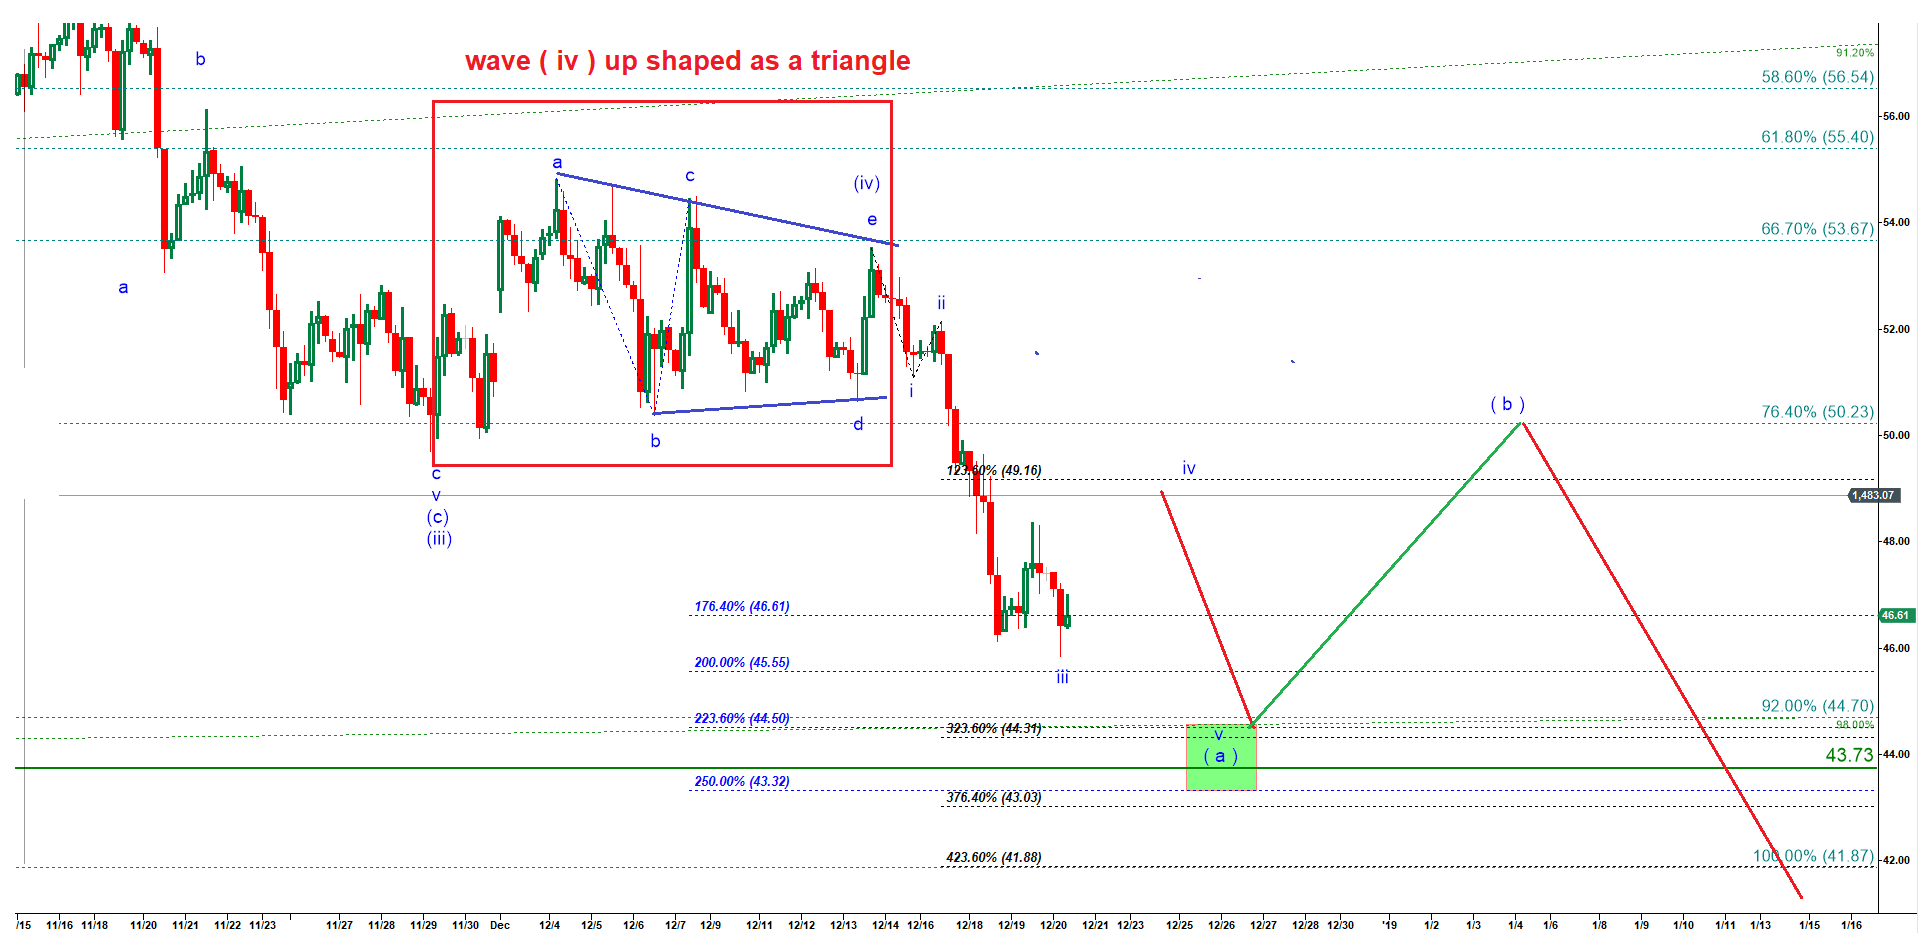
The alternative with a triangle is more bearish because off the point of completion of wave ( iv ) up we should get the final decline in the wave ( v ) down structured as (a)-(b)-(c) waves. This current drop then is only the first leg of decline in the wave ( a ) of ( v ) down.
In conclusion, we have two slightly different scenarios. Under the bullish one (see the first chart) one more low may complete five wave down off the top made 3 October 2018.
Under the bearish alternative, one more low would only complete the first part of the final decline in the wave ( v ) down.
We should wait until we have two high probability scenarios pointing in the same direction. This is when we convert two different counts into a nice trading setup with nice chances to make money.