• Home
  • Free Updates
    • Nailed!
    • Major US Indices
    • Gold & Silver
    • Crude Oil & Natural Gas
    • US stocks
  • UPDATES
    • Subscribe now!
    • US Stock Indices
    • Gold, Silver and GDX
    • Crude Oil & Natural Gas
    • Value and Momentum Stocks
  • Education
    • Beginners Video Course
    • Intermediate Video Course
      • Syllabus of the Course
    • Trading Like A Pro Video Course
    • Video Lesson of the Week
  • Blog
  • Chat Room
  • Pricing
  • FAQ
Menu
  • Home
  • Free Updates
    • Nailed!
    • Major US Indices
    • Gold & Silver
    • Crude Oil & Natural Gas
    • US stocks
  • UPDATES
    • Subscribe now!
    • US Stock Indices
    • Gold, Silver and GDX
    • Crude Oil & Natural Gas
    • Value and Momentum Stocks
  • Education
    • Beginners Video Course
    • Intermediate Video Course
      • Syllabus of the Course
    • Trading Like A Pro Video Course
    • Video Lesson of the Week
  • Blog
  • Chat Room
  • Pricing
  • FAQ

Crude Oil has been following my bearish micro count

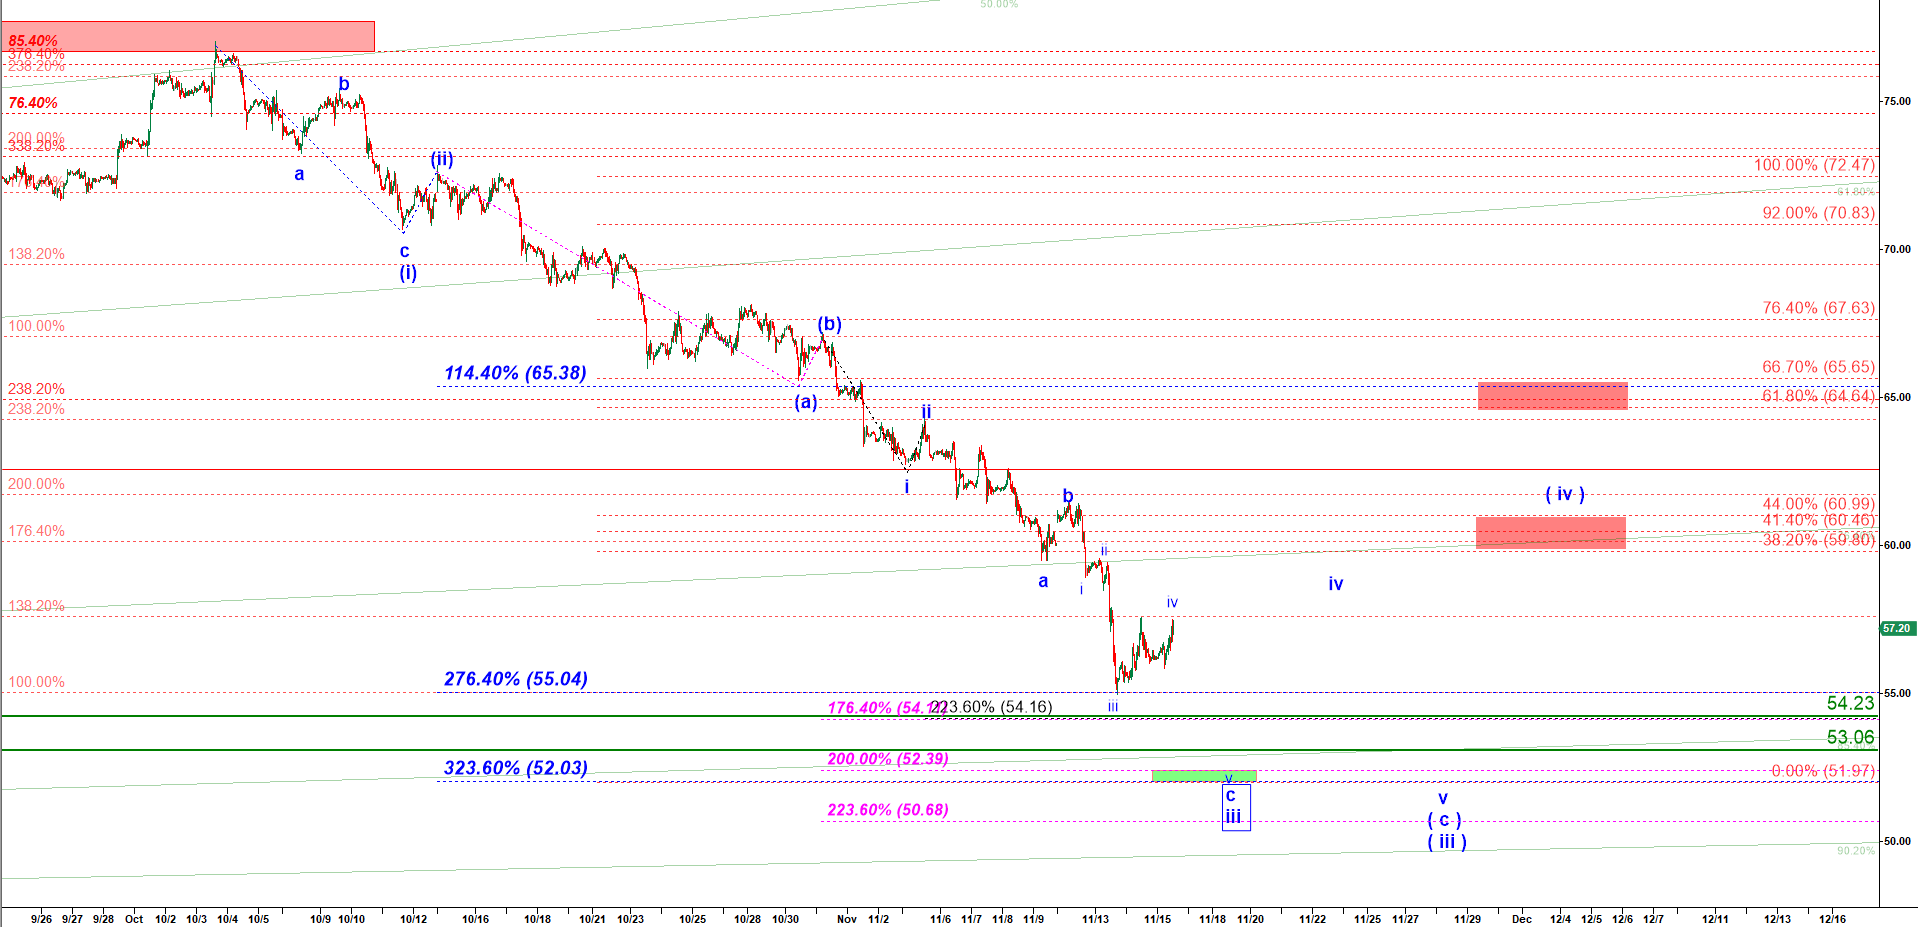
Crude keeps moving down in its wave ( iii ). On 15 November 2018 I posted a chart (find it below ) where I expected a drop from 57 to 52.39.

Crude Oil- 45 min chart - updated on 15 November 2018

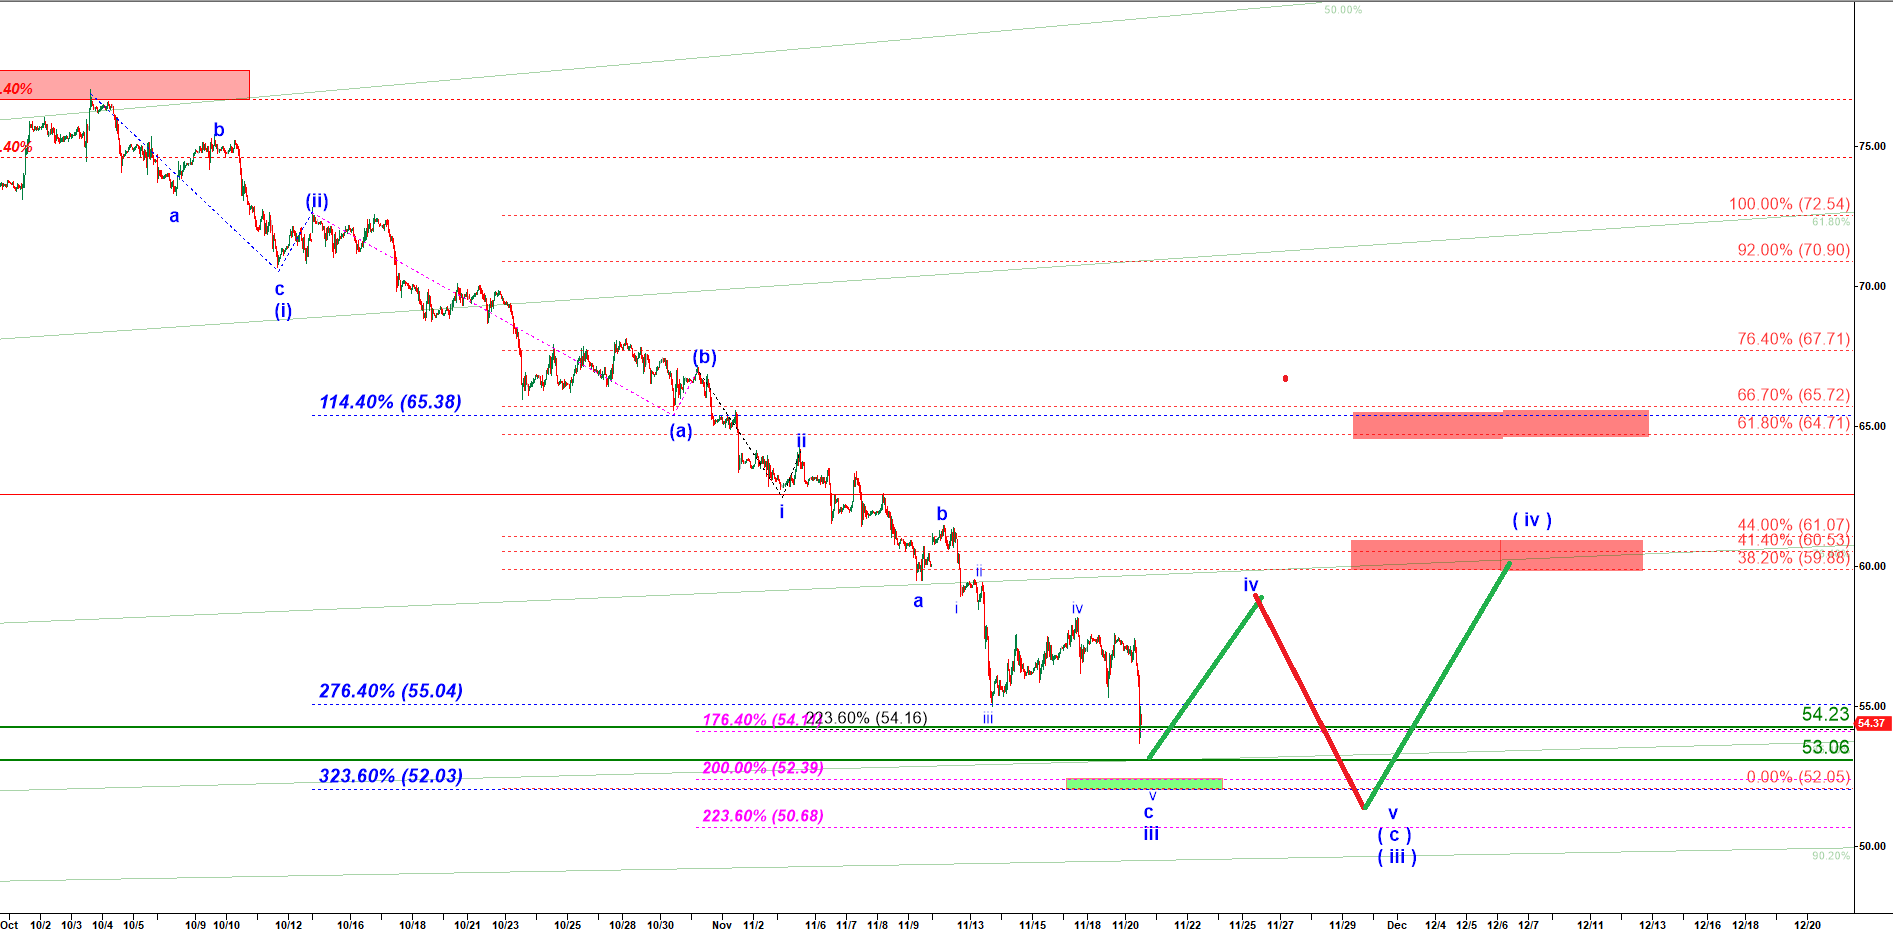
This morning crude dropped to  53.86 (please see the chart below). It still can extend to that green box and we still need to make another run lower fter a pullback because I count this move as only ave iii of c of ( iii ).

From that green box we should see corrective wave iv of c of ( iii ) and then another drop to a new low that would finally complete the large wave ( iii ) off the top reached on 3 October 2018 before we will see a large corrective wave ( iv ) up.

Crude Oil- 45 min chart - updated on 20 November 2018

  • My Account
  • Login
Hestia | Developed by ThemeIsle

Login

Lost your password?