Crude Oil - it is always a bad idea to try to nail a bottom of wave 3 down
We have been counting the move off the lows in February 2016 into the top in October 2018 as a completed A-B-C structure. We still are not sure was that move off the major low a corrective wave 4 up or the beginning of a major rally in wave 1 up. I still favor the last bullish scenario.
The impulsive looking drop off October 2018 high is either wave A of 2 under the bullish scenario( please see the chart below). And under the bearish scenario that could be wave A of 5 down targeting the low reached in February 2016.
My attempt to micro count that decline completely failed. When crude dropped to 223.6% extension which is a typical extension for the wave 3 down we had only a minor pullback and got another drop. At this point the micro structure is not of any help. Therefore we need to zoom-out and check the weekly chart for the major support zones. We also should focus on retracement fibs for the whole A-B-C move up off February 2016 low into the top of 2018.
Crude Oil - Weekly chart updated on 13 November 2018
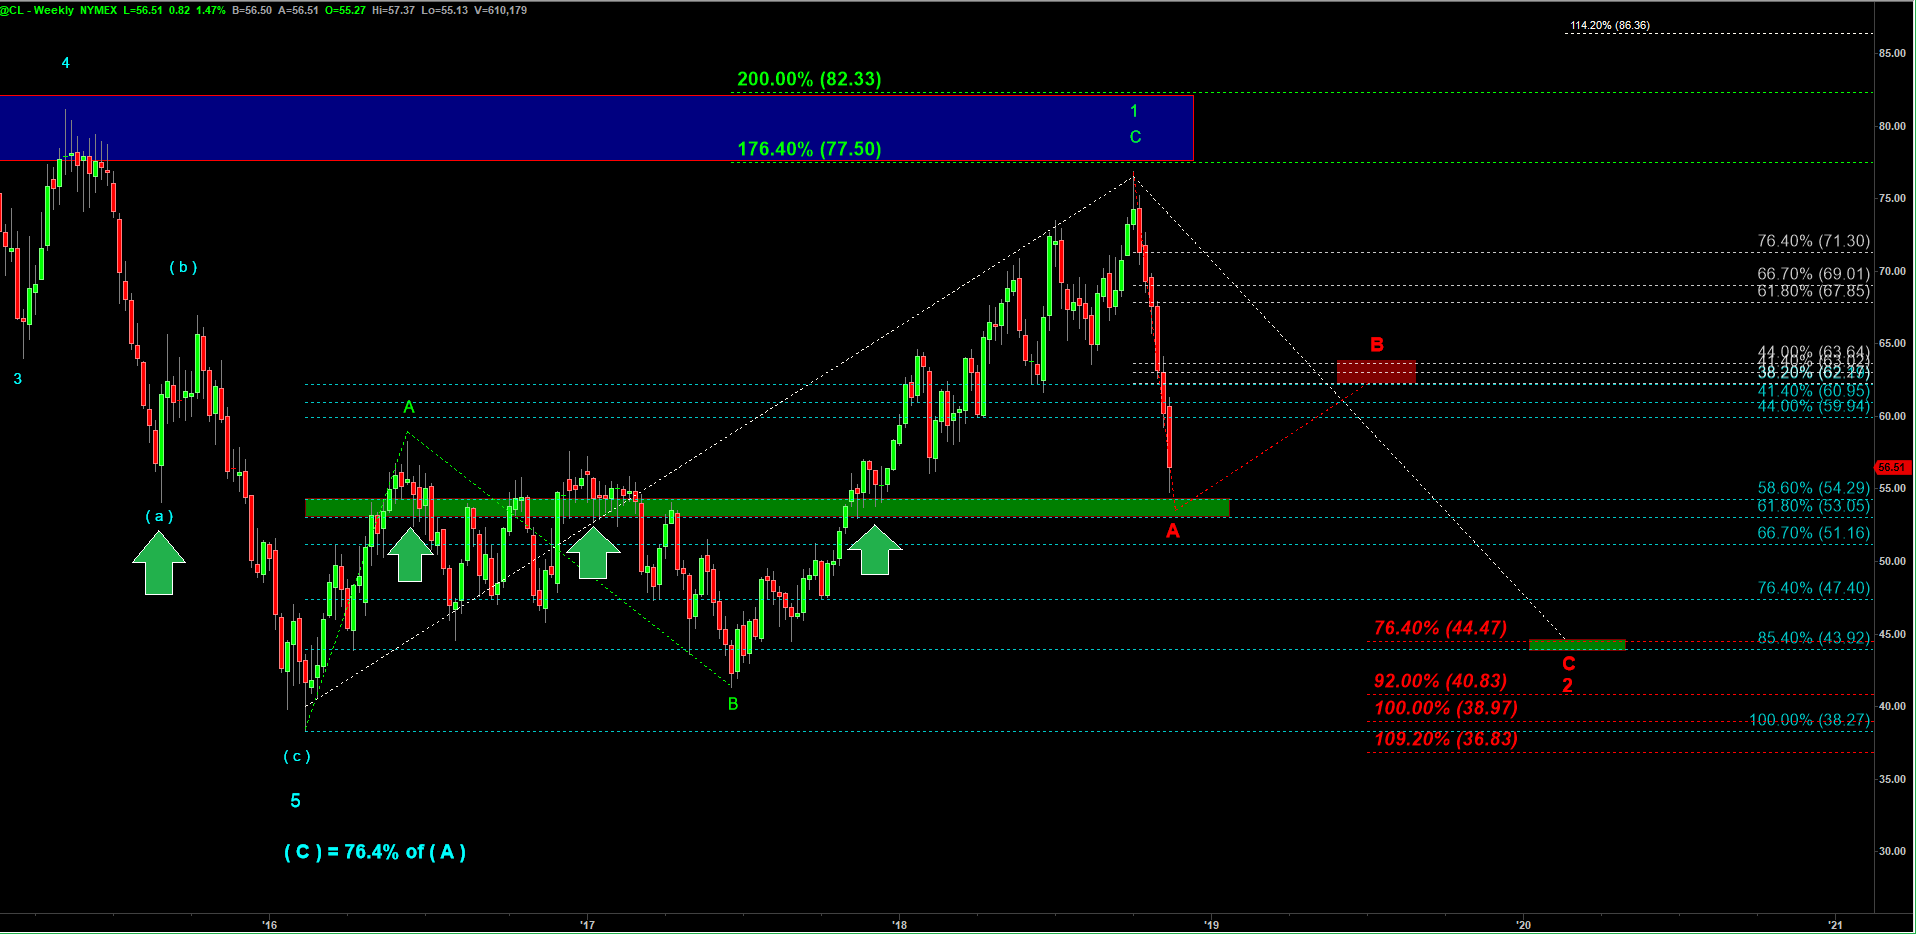
We have two major retracement fibs at 53.05 ( 61.8% retracement) and 51.16 ( 66.7% ).
We should also note the strong demand zone in between of 54.30 and 53.05. There were many times when that zone stopped previous declines. Look at numerous candles with long wicks in that green zone.My expectation is that we will make another run for a lower low into that zone before that move A down gets completed.
Then I would expect a corrective wave B up that may target 62.20 – 64.20.