• Home
  • Free Updates
    • Nailed!
    • Major US Indices
    • Gold & Silver
    • Crude Oil & Natural Gas
    • US stocks
  • UPDATES
    • Subscribe now!
    • US Stock Indices
    • Gold, Silver and GDX
    • Crude Oil & Natural Gas
    • Value and Momentum Stocks
  • Education
    • Beginners Video Course
    • Intermediate Video Course
      • Syllabus of the Course
    • Trading Like A Pro Video Course
    • Video Lesson of the Week
  • Blog
  • Chat Room
  • Pricing
  • FAQ
Menu
  • Home
  • Free Updates
    • Nailed!
    • Major US Indices
    • Gold & Silver
    • Crude Oil & Natural Gas
    • US stocks
  • UPDATES
    • Subscribe now!
    • US Stock Indices
    • Gold, Silver and GDX
    • Crude Oil & Natural Gas
    • Value and Momentum Stocks
  • Education
    • Beginners Video Course
    • Intermediate Video Course
      • Syllabus of the Course
    • Trading Like A Pro Video Course
    • Video Lesson of the Week
  • Blog
  • Chat Room
  • Pricing
  • FAQ

Crude - very deep pullback that so far respected the critical resistance

On December 24 I posted an update where I pointed to a coming pullback up in wave ( b ) up of ( v ) down. Back then my expectations were that the pullback would retrace 61.8% or 76.4% of the drop in wave ( a ) of ( v ).  In fact that pullback retraced more than 90% of that decline. There are two arguments in favor of the bearish count. First, crude so far was unable to breach the critical resistance at $53.54. Second, the structure off the December low (which I count as a bottom of the wave ( a ) of ( v ) ) looks corrective. At this point subwave c of wave ( b ) up stretched to 200% extension of subwave ( a ) which is a strong but not an unusual extension.

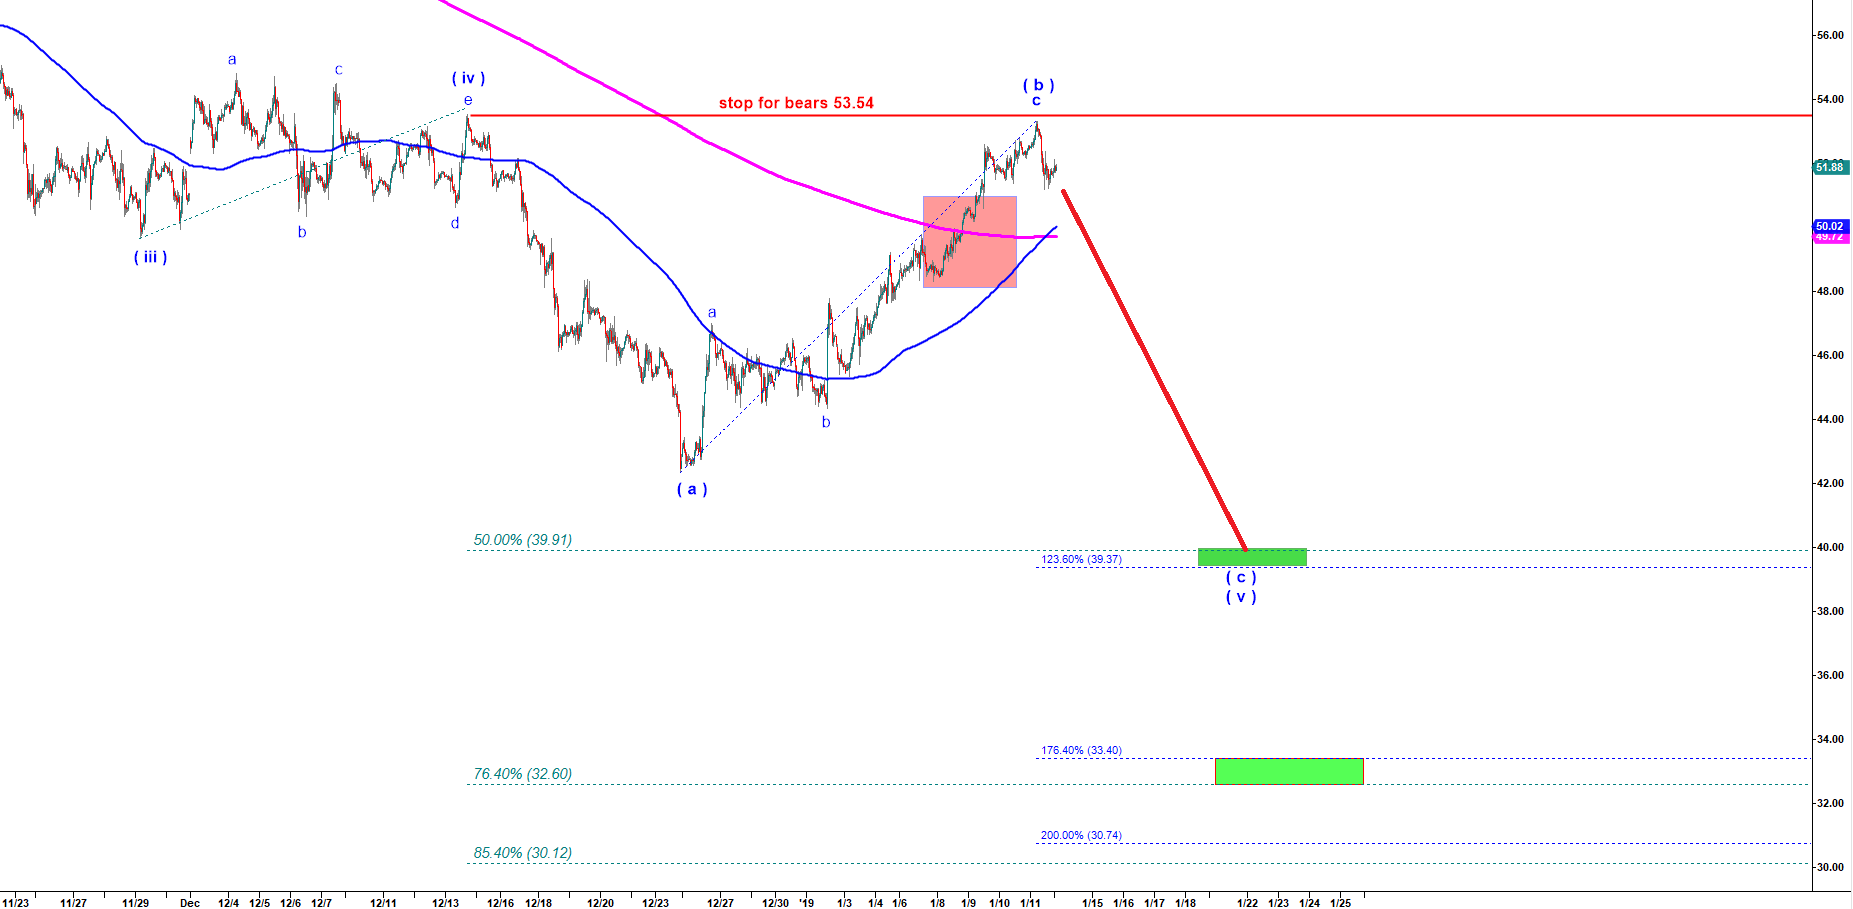
Crude oil - 45 min chart updated on 13 January 2019

Start to learn how to predict the next market move today!
Check out my latest updates
  • My Account
  • Login
Hestia | Developed by ThemeIsle

Login

Lost your password?