FCX - one more push to retest Aug 2015 lows may make it a buy
Freeport-McMoRan Inc is a mining company. It operates large, long-lived geographically diverse assets with reserves of copper, gold, and molybdenum.It’s Net Margin is 28.6%, Return on Capital is 22% and it is traded at only 4.6 x Price-to-Free-Cash-Flow. Equity Value to EBITDA is only 3.60. So the company is profitable, generating strong free cash flow and has a reasonable debt. That makes me look for a good technical setup to go long
First, lets look at a monthly chart. We have a clear [A]-[B]-[C] structure of a rally started in 2001 and topped in May 2008. I count that structure as a huge wave [ 1 ] up. The sharp drop off the top that bottomed at $5.74 in December 2018 is the first leg down of the corrective wave [ 2 ] down.
Then we see a corrective looking rally in wave [ B ] up that topped at $59.73 in January 2011. To complete that large correction of the wave [ 2 ] down we are supposed to get the final decline in wave [ C ] of [ 2 ] off that 2011 top.
That final decline should be subdivided into five waves of a smaller degree. And ideally wave [ C ] should be at least equal in size to the first leg down in the wave [ A ] of [ 5 ].
FCX - monthly chart updated on 16 January 2019
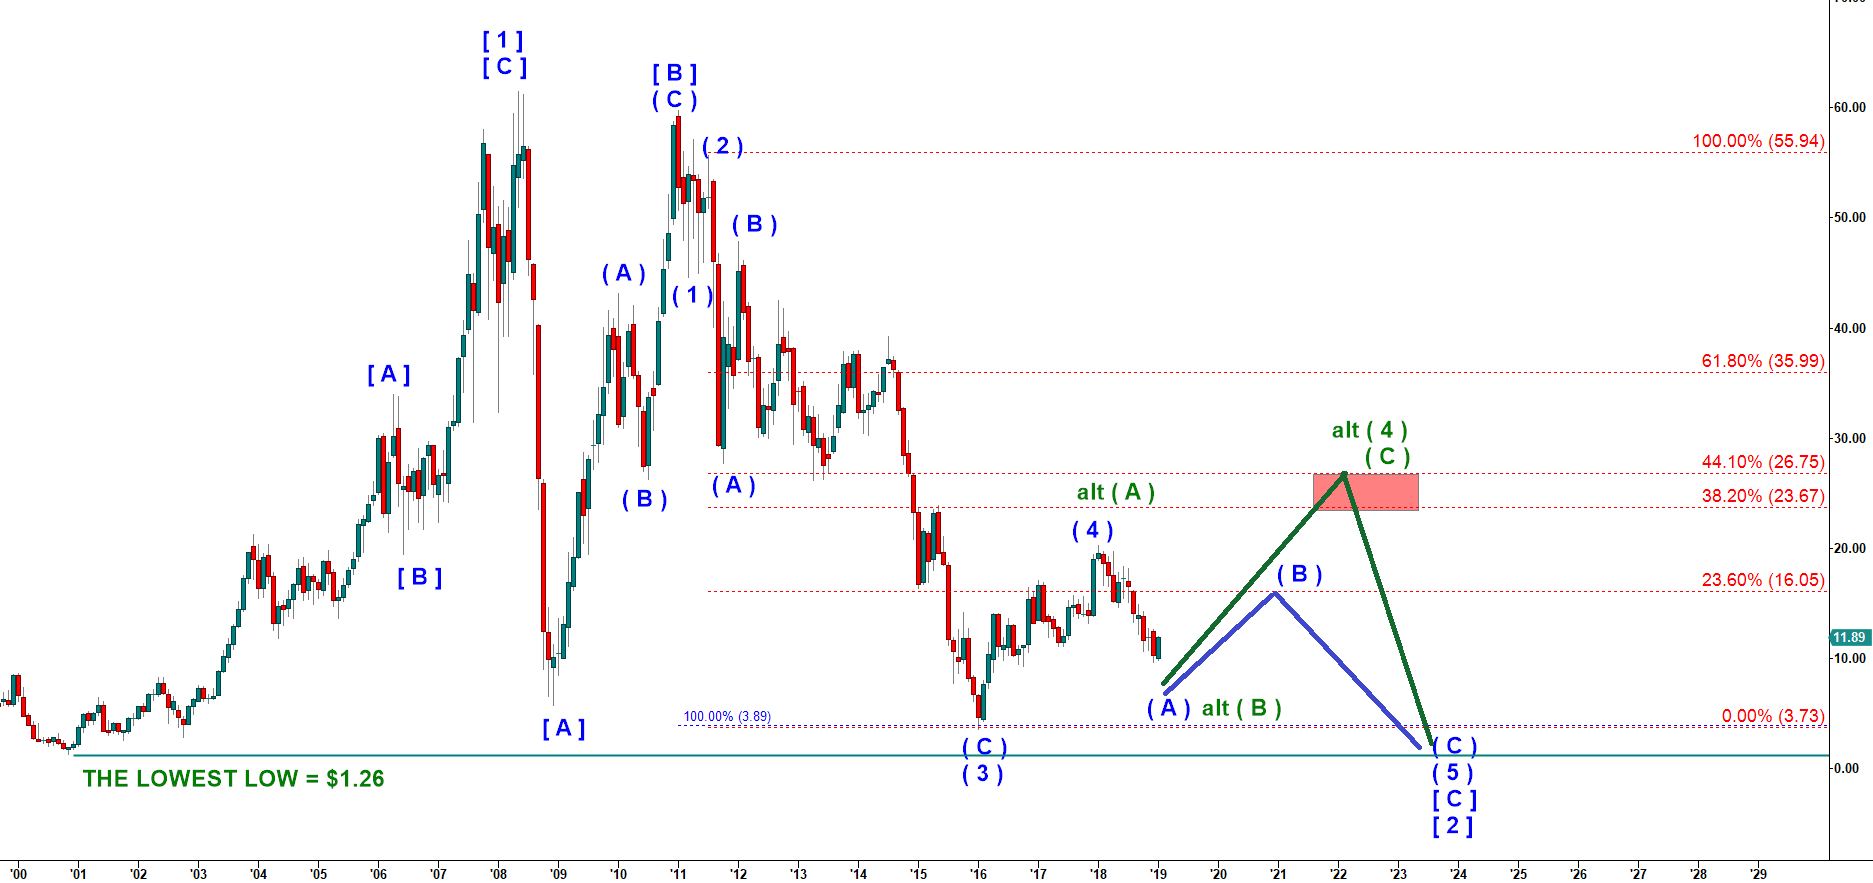
In January 2016 FCX dropped right on 100% extension of the wave [ A ] down! However, as you can see on the monthly chart below, I can not get a completed five wave structure for that final wave [ C ] of [ 2 ]. At best we should count that January 2016 low as a bottom of the wave ( 3 ) of [ C ] of [ 2 ].
The rally off that 2016 low that topped in January 2018 looks corrective. It was either all of wave ( 4 ) up (the blue count ) or only its first leg, subwave ( A ) up of wave ( 4 ) ( the green count ).
Even though e have two alternative scenarios in play you can see that both scenarios are similar in a sense that both expect a pullback from the next lower low.
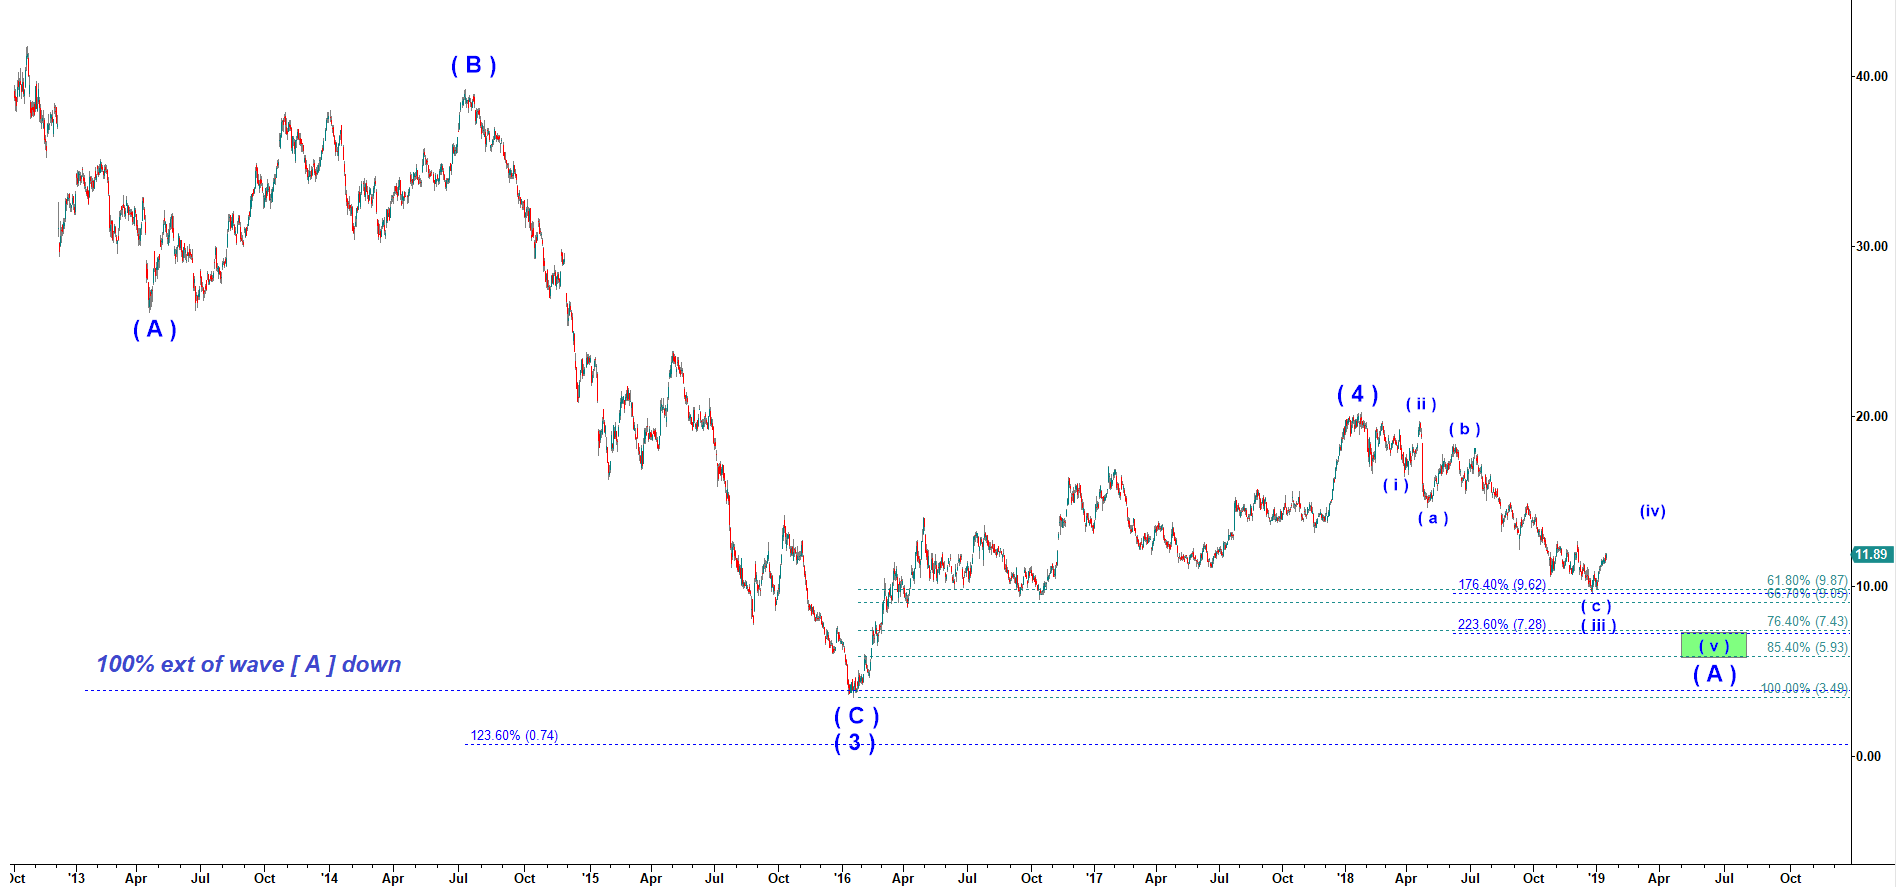
On the daily chart below I propose a micro count of that current decline off the January 2018 top. It seems to me that we should get another drop that may find a bottom in the green target box located in between of $7.43 and $5.93.
FCX - daily chart updated on 16 January 2019