How the Harmonic Elliot Wave theory can help in trading?
The Harmonic Elliott Wave theory proposed that every trending move in price follows the “Five Waves” pattern (please see the chart below).
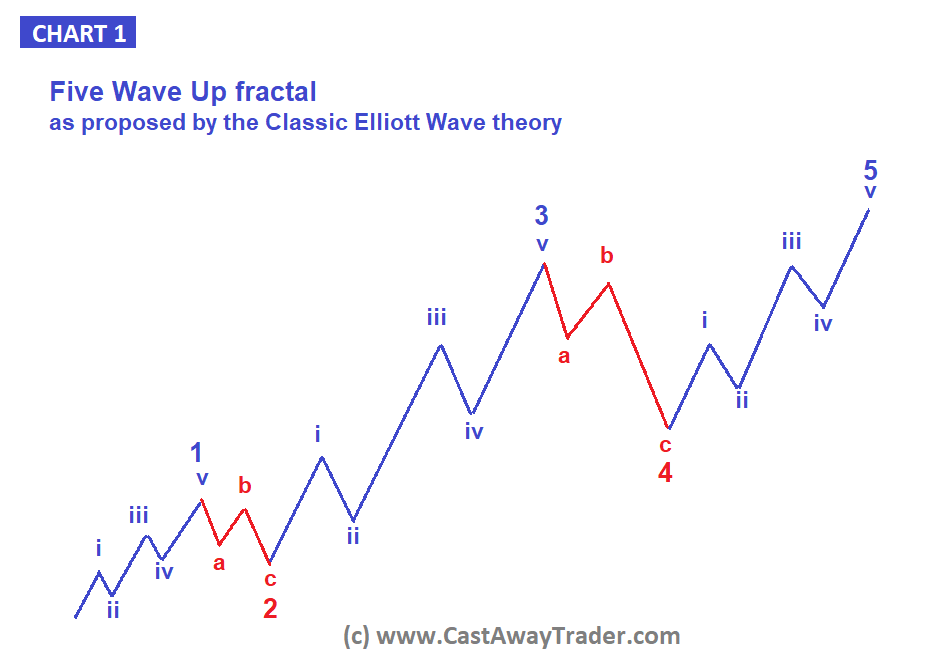
Waves 1, 3 and 5 (in blue color) move price in direction of the trend. And waves 2 and 4 (in red color) are temporary pullbacks in counter trend direction. There are three features of the theory that let us make predictions about the following moves in price.
First, we confidently know that the price will keep moving in direction of the trend until all five waves play out.
Second, the Five Wave fractal has a distinctive look because there are clear rules regarding each segment of the pattern (called “waves“) and repeating precise math ratios between the waves.
For example, the strongest part in any rally is the wave 3, a part of the rally in the middle of the move. With practice you will start to recognize that pattern at a glance. Once you recognize a pattern and a specific current wave you will be able to start making predictions about the next move, a wave that should follow according to the Five Wave pattern. For example, you know that every year has four seasons. You know that spring follows winter, and summer follows spring and then will be autumn that will turn in winter. That is a repeating sequence of seasons in nature. Using that sequence you can predict what season will follow summer. In the same way the Five Wave pattern is a repeating natural sequence that is followed by price of any trending asset on any time frame, from 1 minute charts to monthly charts.
Finally, waves 2, 3, 4 and 5 are related to preceding waves by a number of repeating ratios which can be derived from Fibonacci numbers. For example, wave 3 normally terminates when its length equals either to 176.4% or 223.6% of length of wave 1. To confidently predict when a rally can terminate you only need to identify when waves 1, 2, 3 and 4 are played out and the only wave fifth is left. And then you need to apply several common ratios to identify potential levels where the final wave 5 can get terminated. Because of clear rules and simplicity of this methodology it takes a trained trader only 2 – 3 minutes to make a high probability prediction for a stock, futures or crypto currency even if he sees them the first time in his life.