Skip to content
  • Home
  • US Market Updates
  • Indicators
    • Impulse Master
    • Cycle Trader
    • GANN Levels
    • Subscribe
  • Education
    • Beginners Video Course
    • Intermediate Video Course
      • Syllabus of the Course
    • Trading Like A Pro Video Course
    • Video Lesson of the Week
  • Chat Room
  • Pricing
  • FAQ
  • My Account
  • Login

Subscription: Access to Micro Counts of US indices

ES dropped as expected but lower than expected

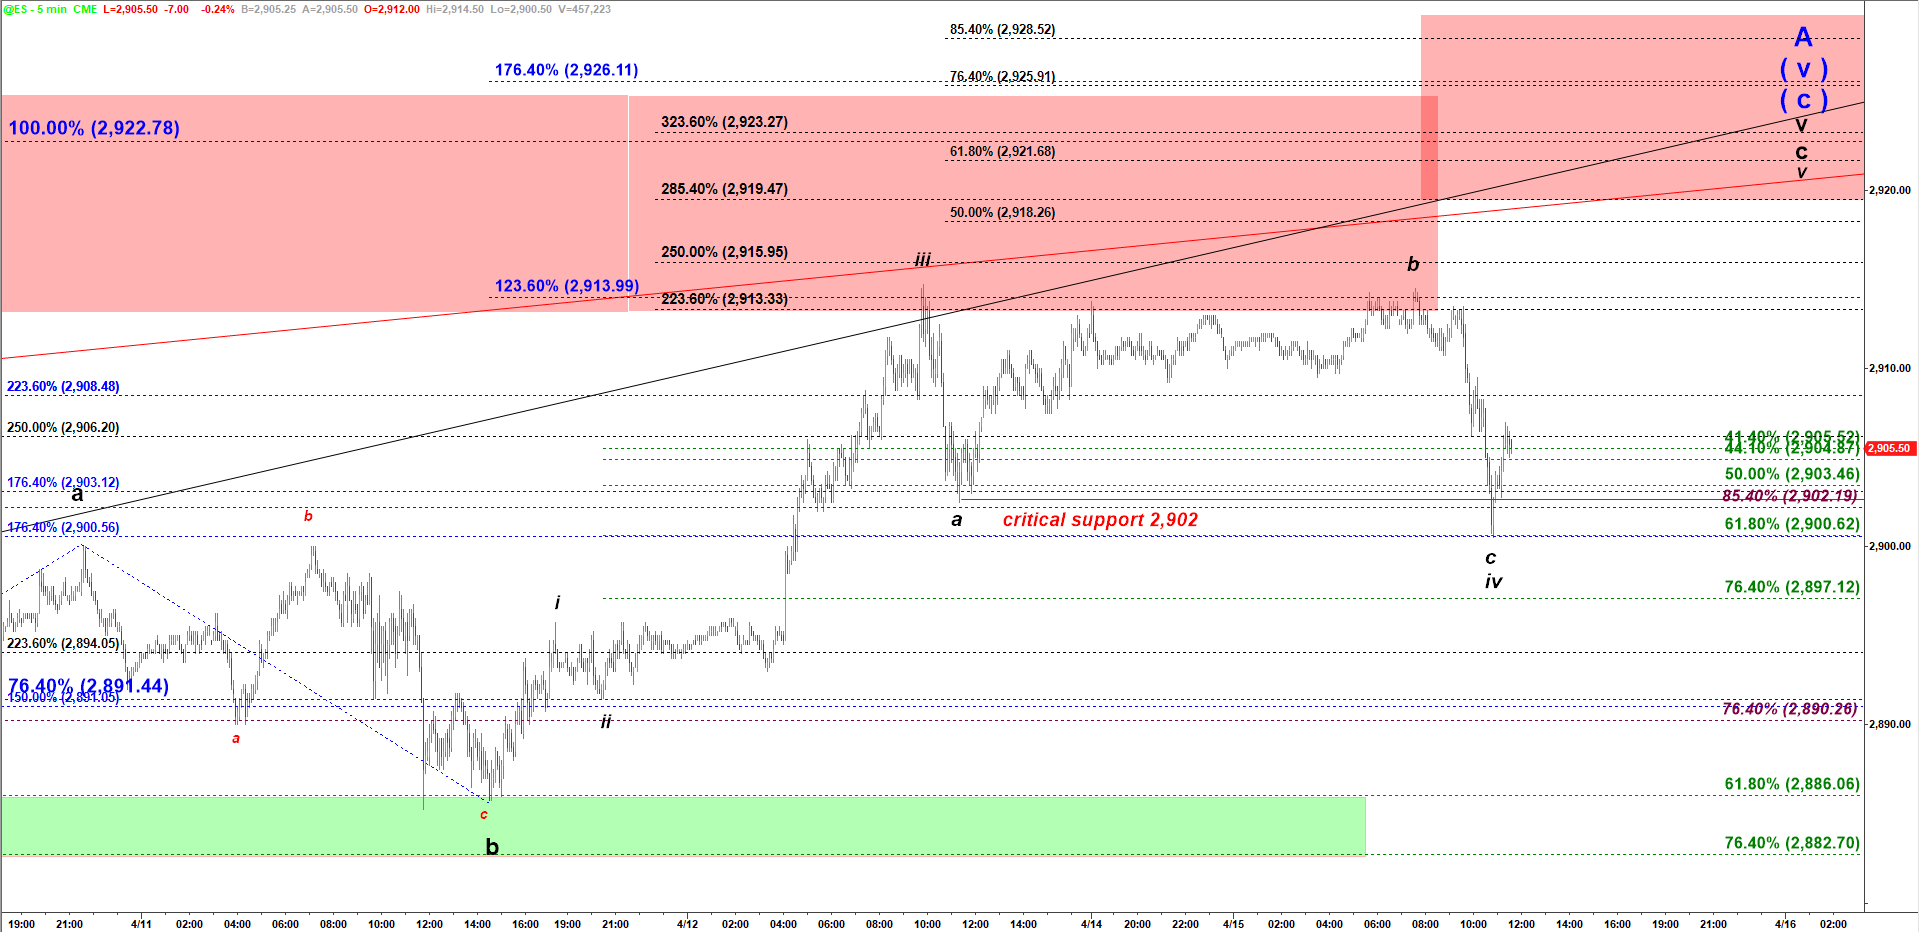
In the previous update this morning at 8:05 AM I predicted that drop and wrote:

“ES may give us a micro pullback to 2,908 – 2,905 before the final thrust higher in the very final micro squiggle in wave c of v.“

We got the drop but it dropped lower then I expected. The low so far was 2,900.50. It has brokenunder the immediate support on my chart at 2,902. However, there is a scenario where ES still holds potential for another rally to a higher high. If we count that drop as wave c down of an expanded flat corrective structure then it still has that bullish potential. 

ES mini - 15 min chart updated at 11:35 AM on 4/15/2019

11:36 am MONDAY

Previous posts:

No posts found.
© 2025 CastAway Trader • Built with GeneratePress