• Home
  • US Market Updates
  • Education
    • Beginners Video Course
    • Intermediate Video Course
      • Syllabus of the Course
    • Trading Like A Pro Video Course
    • Video Lesson of the Week
  • Blog
  • Chat Room
  • Pricing
  • FAQ
Menu
  • Home
  • US Market Updates
  • Education
    • Beginners Video Course
    • Intermediate Video Course
      • Syllabus of the Course
    • Trading Like A Pro Video Course
    • Video Lesson of the Week
  • Blog
  • Chat Room
  • Pricing
  • FAQ
COURSE MENU
< Retracement by Wave B
Retracement in wave B >

Watch Video Lesson

Retracement Ratios. Wave B down

WATCH NEXT VIDEO

Retracement Ratios. Wave B down

Retracement Ratio of Wave B = Wave B / Wave A * 100%

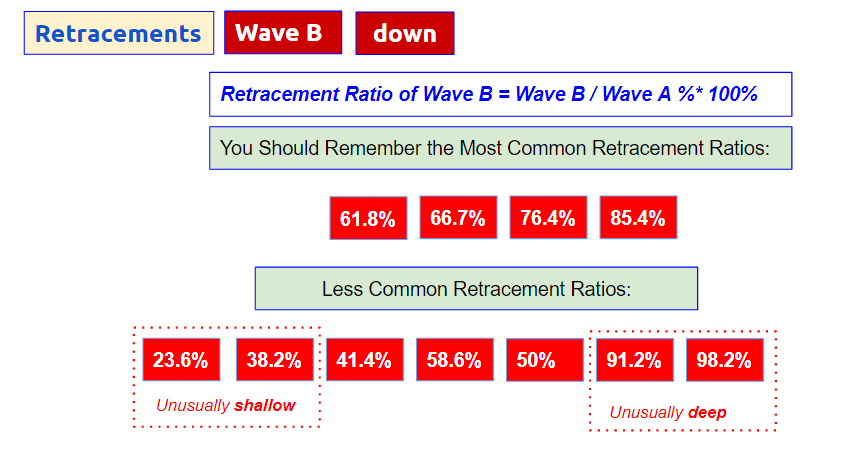
Corrective Wave B is always shorter than preceding impulsive wave A. 
Wave B down reacts to a preceding impulsive wave A up. We always measure counter trend wave B down in terms of ratio of its length to length covered by preceding wave A up. We call such a ratio “retracement ratio”.

LEARN MORE

MAIN FEATURES

  • Corrective Wave B reacts to preceding Wave A.
  • To predict a target for Wave B we should measure length of preceding Wave A and apply common retracement ratios to the length of Wave A.
Learn how to find a target for wave B down

Case Studies:

The best way to understand how this pattern works is to study collection of charts with real life examples.

  • Subscribe Now and Start Learning
Section 8. How to Measure and Predict Targets for Corrective Waves.
  1. Introduction to Section 8.
  2. How to measure corrective wave 2 with retracement ratio.
  3. Wave 2: the most common retracement ratios.
  4. How to measure corrective wave 4 with retracement ratio.
  5. Wave 4: the most common retracement ratios.
  6. How to measure corrective wave B with retracement ratio.
  7. Wave B: the most common retracement ratios.
  8. Case Studies: Application of Retracement Ratios.
Tags
$ES $SPX a-b-c- up pullback a-b-c up Bearish reversal Bear Market Rally Bitcoin Bottoming Breakdown breakout Bullish Wedge Crude Oil Daily Double Three DXY ES Expanded Flat Expanding Triangle failed breakdown failed breakout Green Box Head and Shoulders i down - ii up setup Inverse Head and Shoulders i up - ii down setup Macro micro Month Opening Range NQ one more high one more higher high Red Box RTY Running Flat S&P short setup SPX topping toppying trading setup triangle Triple Three weekend Weekly YM
Read my Blog

  • My Account
  • Login
Hestia | Developed by ThemeIsle