CELG - inexpensive free cash flow generator in a BUY zone with a tight stop
Celgene is a biopharmaceutical firm that discovers, develops, and markets therapeutics for the treatment of cancer and immunological diseases. It has a market capitalization of $49.2 bln. CELG is currently is traded at 12.4 Price-to-Free-Cash-Flow ratio that does not make it a decent value stock.
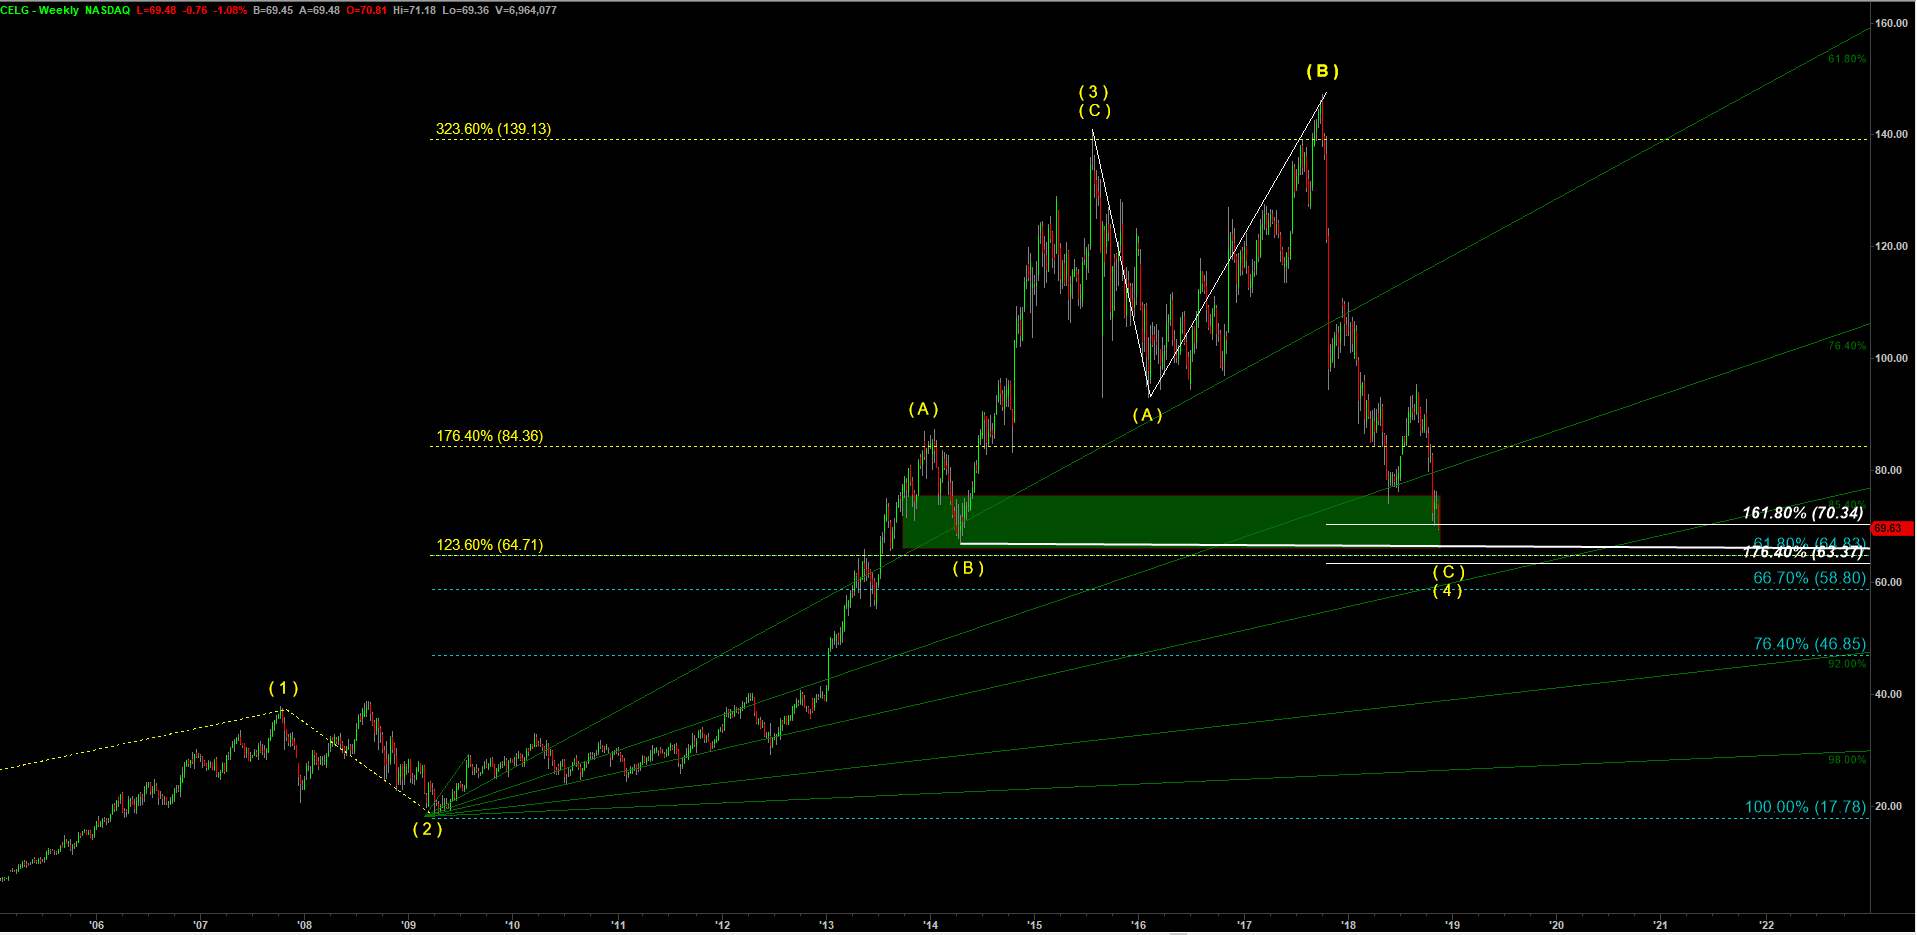
I count the top made by CELG at $140.72 in July 2015 as the top of the wave ( 3 ) up. The first leg of corrective wave ( 4 ) bottomed at $93.05 in February 2016. The following rally managed to make a new higher high over the top of the wave ( 3 ) up at $147.17 in October 2017. Nevertheless I count that rally as wave ( B ) up, part of the corrective wave ( 4 ) down, under the expanded flat correction.
Off the top of that wave ( B ) up we should get an impulsive looking decline that should make a new lower low under the low reached by the first leg of correction in wave ( A ) of ( 4 ) down. Moreover, that wave ( C ) of ( 4 ) under the expanded flat corrective pattern tends to stretch to 161.8% – 176.4% of the wave ( A ) of ( 4 ). That gives us a target zone of 70.34-63.37.
Because we deal with a correction to preceding rally in the wave ( 3 ) up we should check retracement ratios to that wave ( 3 ) up. As you may see, the cyan color 61.8% retracement level is at $64.83.
According to Harmonic Elliott Wave theory, wave ( 4 ) down should not violate the low of the corrective wave ( B ) of ( 3 ) which is at $66.85. That is our hard stop. If we go long here we risk $3 per share. If this count is correct, than we should expect a rally in wave ( A ) of ( 5 ) targeting the highs of 2015 in the neighborhood of $140. So our potential reward is $70 per share.
CELG - Weekly chart updated on 14 November 2018