
Blog
The classic Elliott Wave theory is dead — Long Live the Modified and Better Elliott Wave theory!
Part 1. Why the classic Elliott Wave theory is useless in trading
In 1930s Ralph Nelson Elliott made a great discovery that dramatically changed the way how traders and portfolio managers make investment decisions. After reviewing numerous self-made price charts of stocks and commodities he noticed several repeatable patterns drawn by price of assets. He noted that major rallies and declines of price for different assets did not happen in a straight line fashion. Every move up is followed by a pullback down. Every major lasting decline of price for tradeable assets like stocks or commodities was interrupted by a counter trend move in opposite direction.

Elliott noted that those price moves in the main direction of the trend and counter trend moves in opposite direction together combined a specific pattern (on the chart above). He decomposed that repeating pattern into several segments when price moved in one direction before a move in a countertrend direction (the red segments on the chart point down and follow blue segments that point up). He called those segments in price charts “waves”. Based on his observations of the actual price charts he was able to generalize main features of that repeating five wave fractal:
1. He called waves 1, 3 and 5 “impulse waves”. In a five wave fractal pointing up waves 1,3 and 5 push price to new higher highs. Wave 3 pushes the price to a new higher high over the top of wave 1 up. And wave 5 pushes price to a new higher high over the top of preceding rally in wave 3 up.
2. He called waves 2 and 4 “corrective waves”. In the five wave up fractal waves 2 and 4 are temporary pullbacks in direction opposite to the direction of the main trend. Wave 2 down is a reaction to a rally in wave 1 up and therefore shall never breach the starting point of the wave 1 up. Or we can say that wave 2 shall not retrace more than 100% of the wave 1 up.
3. Elliott proposed that a corrective wave 4 down shall never go under the top of an impulsive wave 1 up. As a consequence of that rule wave 4 down should make a higher low in comparison to preceding corrective wave 2 down. Because impulsive waves 1, 3 and 5 are supposed to make higher highs and corrective waves 2 and 4 are supposed to make higher lows, the five wave up fractal is a backbone of any trending move up. Indeed, every trader knows that an up trend is a sequence of higher highs and higher lows made by price. Conversely, a down trend is a sequence of lower lows and lower highs.
4.Elliott noted that normally wave 3 is the strongest wave in the five wave fractal. However, the rule he proposed was not that strict. He said that wave 3 could not be the shortest, meaning that he acknowledged possibility that either wave 1 or wave 5 may get extended and be stronger than wave 3.
5. What made that theory a great trading tool is another very important observation made by Elliott about fractal nature of price moves. He found out that waves 1, 3 and 5 are themselves subdivided into five smaller waves. And that smaller waves would follow the very same rules applicable to bigger five wave fractal.

On the chart above you can see that waves 1, 3 and 5 are composed of five smaller waves labelled as i, ii, iii, iv and v.
In contrast, the corrective waves 2 and 4 have different structure. They are composed of only three smaller waves or “subwaves” a, b and c.
The five wave fractal was simply too perfect to be found in every market and any time frame.
The theory was supposed to make trading and investing as easy as counting from one to five! Indeed, you sell when you can count five micro waves up and you buy again at lower price when you get an a-b-c shaped corrective move down! The same set of riles can be applied to price charts of any time frame, from 5 min to a monthly one. What could have been easier?
It seems like pretty soon Elliott realized that the five wave fractal could not explain every trending price move either up or down. The five wave fractal was simply too perfect to be found in every market and any time frame. He and followers of his theory found many cases where the final wave 5 did not have that perfect subdivision into five smaller waves. And then practitioners of the classic Elliott Wave theory called such case a “truncation”. In plain English it sounds like: “Oops, the theory can’t explain this so lets agree its a rare exception. Lets find a fancy name for that unfilled gap in the theory not to apologize for our inability to nail the top.”

On the chart above you will see that the final wave 5 up is subdivided into three smaller waves instead of five waves as prescribed by the Classic Elliott Wave theory.
You may say I exaggerate the problem because truncations happen at the very top of the five wave up fractal or very bottom of the five wave down fractal. But let me remind you that the main benefit of the theory was to provide a trader with a mighty yet simple-to-use prediction tool based on assumption that any larger wave or subwave in direction of the trend has to be be subdivided into five waves. Some protagonists of the classic theory may say that I misunderstood the idea behind that method. However, Elliott himself became known for several accurate predictions about exact tops and bottoms in the Industrials index in 1935.
One of the most valuable principles of the theory was that the final fifth wave can not stop until it fully replays its own five wave structure of a smaller degree. By complete its own waves i, ii, iii, iv and v wave 5 gets completed and finalizes the whole bigger five wave up fractal.
I personally got fooled by that theory many times. I expected any wave 5 up to keep pushing price higher until I could finally count five micro waves inside it. And then suddenly after micro wave iii of 5 price would collapse… That could mean that you might have followed that unfolding five wave up fractal for weeks preparing to short its completion in anticipation of a larger corrective move in counter trend direction only to see it collapsed prematurely! And I used to be left behind mumbling to my followers that according to the theory we really needed one more high in micro wave v of 5…
Imagine your boss assigns you a specific task but you perform only 66% of what he said. And then time comes to report and you present a partially completed job explaining that you have truncated the task. Would your boss be pleased with that type of explanation? I was certainly not!
More exceptions to the theory
But that was only the beginning of the problems with the real life application of the Classic Elliott Wave theory. Pretty soon practitioners of the classic theory found waves in direction of the main trend that were supposed to be structured as impulsive waves and to follow the five wave fractal but they did not. Instead they were just a bunch of a-b-c’s, three wave moves. Did that observation make Elliott or his followers to change the tenets of the theory? Of course not! They called those uncomfortable cases when the theory did not work “exceptions”. This is how they introduced the “Leading Diagonal” and the “Ending Diagonal”.

The “Leading Diagonal” can be found on the chart above at the beginning of the five wave fractal, in wave 1. As you can see, the five micro waves i, ii, iii, iv and v together compose a large wave 1 up. But note that each of those five micro waves, impulsive and corrective alike, is composed of three waves a-b-c instead of canonical five micro waves.
The “Ending Diagonal” can be found at the very end of the five wave fractal, wave 5. Again, as you can see on the picture below, all the five micro waves that compose wave 5, impulsive and corrective alike are composed of three micro waves a-b-c.

At this point I want to remind you that the main idea behind the Classic Elliott Wave theory was that price follows a specific repeating five wave fractal and impulsive waves within that fractal are composed of five waves of a smaller degree. However, as we can see, the author and practitioners of the classic Elliott Wave theory had to admit that the main assumption of that theory just did not work all the time…
Many people do not like the classic Elliott Wave theory because of “overabundance of rules and guidelines“. I do not agree. I am thoroughly convinced that in contrast the main problem of the classic Elliott Wave theory is that it does not have enough rules and leaves too much for subjective interpretation. Let me give you an example. As I mentioned before, the only requirement the classic theory proposed for wave 3 is that it can not be the shortest. But that vague principle leaves a lot of room for alternative interpretations and let practitioners to come up with really ugly counts without formal violation of the official rules. Because the classic theory was unable to formulate any specific rules about recognizing wave 3 its practitioners had to conclude that it is nearly impossible to nail the top of the wave 3 up or bottom of the wave 3 down.
Why do you need to learn the classic Elliott Wave theory and how you are supposed to trade based on it?
Let’s talk business. What high probability setups Elliott Wave theory may offer? Well, every single practitioner of the classic theory would tell you that you’ve got to trade wave 3. Remember, wave 3 is normally the longest wave inside the five wave fractal. Then you should say, ok, I like that idea but how I can catch that monstrous move in direction of the trend?
The classic theory proposes that you get the first move up off a major low which has an impulsive structure, meaning it is composed of five smaller waves. That would be your wave 1 up. At this point the majority of market participants do not believe that the initial move up is anything but a temporary pullback before resumption of a preceding down trend. That initial move up is followed by a move down subdivided into three waves of smaller size. You count those three small waves as “a-b-c”. Together they compose a corrective wave 2 down. That pullback in wave 2 down quite often retraces substantial part of the preceding rally in the wave 1 up. At this point many bears use any move up as opportunity to add to their shorts. In contrast, there are very few bulls who is ready to start buying. The general sentiment in the market is still bearish.
That wave 2 down, as you may remember from the discussion above, should not violate the starting point of the wave 1 up. As soon as you get that wave 1 up and corrective wave 2 down you are supposed to get that monstrous rally in wave 3 up. At this point you should ask me what the target for that monstrous wave 3 is. Well, this is another problem. Because the theory does not give you an answer to that vitally important question. For example, the most influential book about the classic Elliott Wave theory called “Elliott Wave Principle” written by A.J.Frost and R.Prechter does not offer any technique to set up a target for wave 3. The book does not even try to describe any common ratios between wave 1 and wave 3. Elliott himself was aware of only the one “golden” 0.618 ratio between waves. Back then he applied that ratio predicting termination of a corrective wave once it reaches that ratio to a preceding impulsive wave.
Nevertheless, many books written by followers of the classic Elliott Wave theory propose a guidance that the distance covered by price in wave 3 exceeds the distance covered by price in the wave 1 by 161.8%, 261.8% or 461.8%. Based on that guidance you may attempt to prepare a following trading plan:

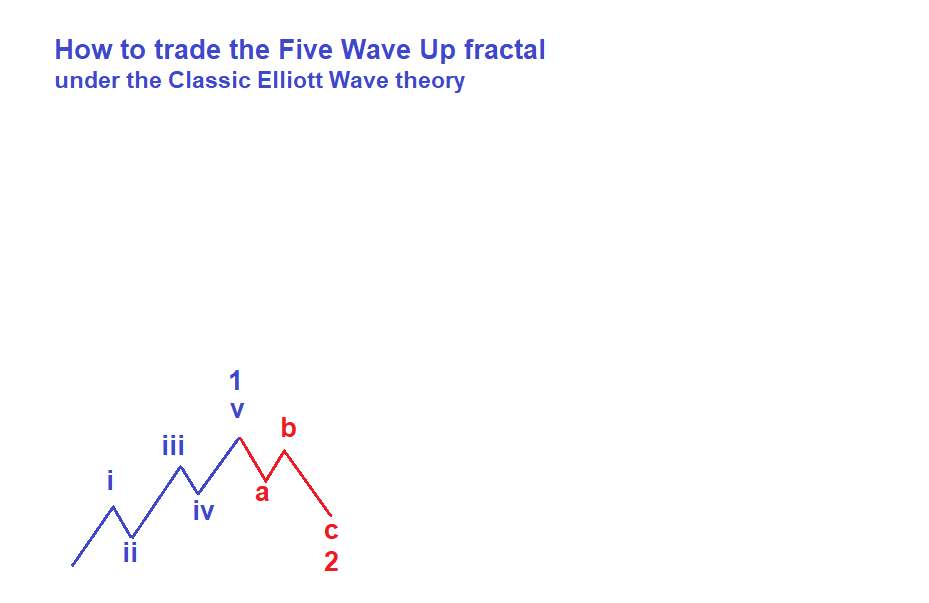
As soon as you get wave 1 off the low structured as micro five waves followed by a corrective pullback in wave 2 down structured as micro three waves a-b-c you go long expecting a strong rally that would move the price to at least 161.8% of the first move up in wave 1 up. Moreover, because we know that wave 2 down shall not breach the starting point of the wave 1 up we can set our stop loss right under the lowest point of the wave 1 up.
Now I will show you what price typically does in that kind of a setup.
As expected, off the bottom of the corrective wave 2 down we did get an impulsive looking rally subdivided into five smaller waves. However, the problem is that rally normally only slightly exceeds the top of the wave 1 up. Instead of an impressive rally that was supposed to be longer than the wave 1 by at least 61.8% we normally get a move equal in size to the wave 1 up. And then we get another deep corrective a-b-c move down.
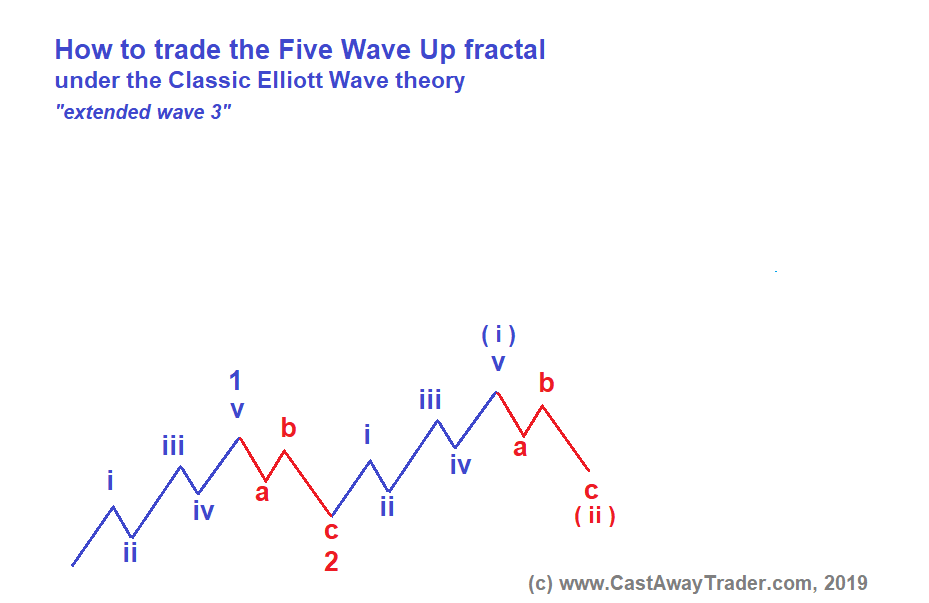
To explain that price behavior Elliott came up with another fancy term “extension”. As you can see on the chart below, that strange impulsive looking rally that supposed to be a monstrous wave 3 up but failed to exceed in size the first move up off the low in the wave 1 now is counted as subwave ( i ) of the wave 3 up.
Let me give you an example. You watch a nice ad on TV where they offer you a shiny German SUV that would be better than what you drive now. You pay the hefty price and start counting days to pick it up from a dealership. On a due date you come to the dealership and they give you four wheels instead of the car. And they say: “Look, dude, now we can give you the wheels and if you stay patient you will eventually get the whole car!”. But this is not what you paid for!
The classic Elliott Wave theory created a myth about a mighty wave 3. Every trader who studies the theory is brainwashed that he should be looking for an opportunity to trade only wave 3 because within that wave price covers the longest distance and all pullbacks are of limited size and duration. That reminds me a phenomenon of rogue wave, which was popularized by Hollywood and became widely known. Rogue waves, also known as monster or killer waves, are large, unexpected and suddenly appearing surface waves that can be extremely dangerous, even to large ships such as ocean liners. But the latest research in physics concluded that: “rogue events do not necessarily appear without a warning, but are often preceded by a short phase of relative order” (Predictability of Rogue Events, Simon Birkholz, Carsten Brée, Ayhan Demircan, and Günter Steinmeyer, Physical Review Letters 114, 213901, 28 May 2015).
That conclusion can be fully applied to wave 3, a rogue wave, in financial markets. When traders expect a monster rally right after completion of a corrective wave 2 down they get fooled. Because what they do get instead is a relatively weak starting move up in wave ( i ) of 3 followed by a pullback in wave ( ii ) down. And if you buy calls in anticipation of a killer rally you end up losing money. Because that wave ( i ) of 3 may last weeks and your call options will expire worthless way before that wave reaches expected 161.8% extension target!
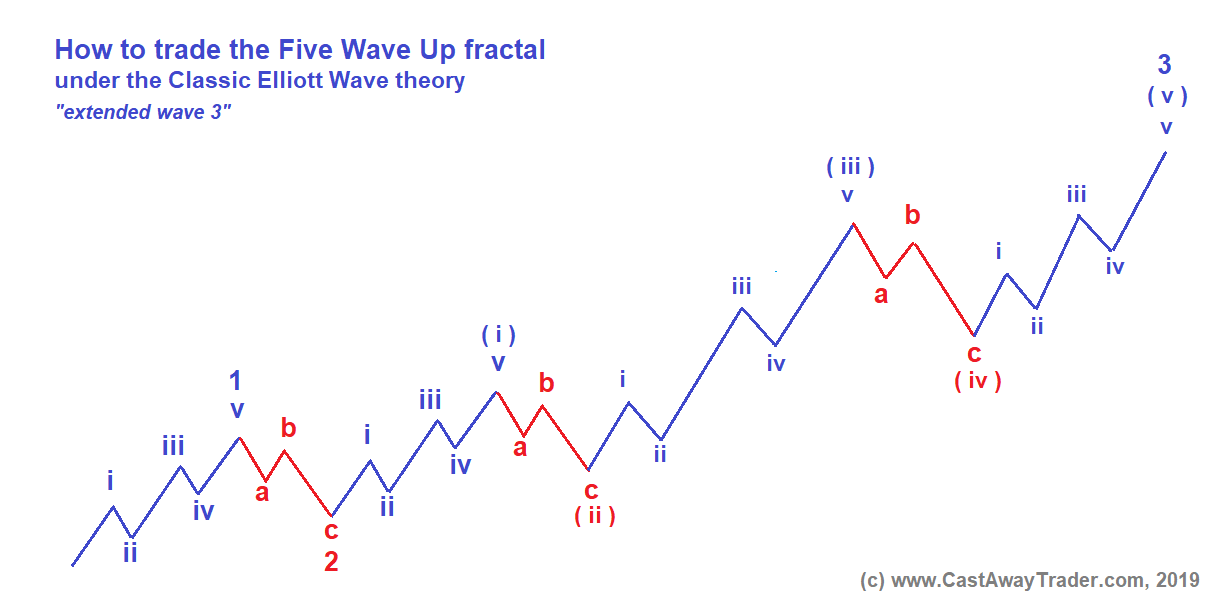
The structure on the chart above does make a lot of sense. It’s not a problem to accept that the wave 3 is itself subivided into waves (i),(ii),(iii),(iv) and (v) and waves (i), (iii) and (v ) are accordingly subdivided into micro waves i, ii, iii, iv and v. The real problem is that the classic Elliott Wave theory is unable to predict whether you will or will not get that extended structure. There are cases when you get that monster move up right off the bottom of the wave 2 down. But there are plenty of cases when you get slow moving wave ( i ) of 3 and then a corrective wave ( ii ) of 3. By the time those waves ( i ) up and ( ii ) down get completed the majority of traders gives up their hopes about making big buck on a monster wave 3 rally!
There is another weakness of the classic Elliott Wave theory. It does not provide you with any guidance with respect to typical targets for waves (i),(ii),(iii),(iv) and (v) inside that killer rally of the wave 3. Again, you only know that the wave ( iii ) of 3 should be at least 161.8% of a size of the wave ( i ) of 3 and you know that the wave ( v ) of 3 should target at least 161.8% of the wave 1 up.
Now lets talk about a corrective wave 4 and the quality of guidance that the classic Elliott Wave theory may provide us with its respect.

The classic five wave up fractal implies a corrective wave 4 down starting off the top of the wave 3 up. That wave 4 down should have a corrective structure. It has to be subdivided into three waves or a combination of three waves fractals called double three or triple three. There are cases when wave 4 is subdivide into five waves that are shaped as a triangle. So as you can see, unfortunately, Elliott found a wide variety of alternative shapes for corrective waves and could not come up with any hard rule that could reliably predict a specific shape of upcoming correction. If we can not predict a shape of a corrective wave 4 may we at east predict its depth? Well, the only rule with respect to wave 4 is that it shall not violate the top of the wave 1 up.
But as we have learned, Elliott had exception for almost every rule! You may remember, that I mentioned above that Elliott found many cases when price was moving up in five waves making a sequence of higher highs and higher lows or moved down in five waves making lower lows and lower highs but in contradiction to his theory, waves 1, 3 and 5 did not subdivide into five waves of a smaller degree. That forced him to call that formation an exception that he called the “Leading Diagonal”. You can see it on the chart below. Under the “Leading Diagonal” fractal a corrective wave 4 down is allowed to drop under the top of an impulsive wave 1 up!

Finally, let’s talk about the wave 5. That is the final wave that should complete the whole five wave fractal. The Classic Elliott Wave theory gives us two important rules about the wave 5. First, wave 5 has to make a new higher high over the top of the preceding rally in the wave 3. Second, wave 5 has to have an impulsive structure and be subdivided into five waves of a smaller degree.
And, as you may have already figured it out, the above mentioned rules have exceptions! You may remember that Elliott introduced the Ending Diagonal structure where wave 5 is subdivided into five smaller waves but waves i, iii and v are constructed as a-b-c’s (please see below).

But what makes things even worse is that Elliott acknowledged that in some cases wave 5 may fail to make a new higher high over the top of the wave 3 up! Elliott called that unfortunate situation by a simple word “failure”. Years later Robert R.Prechter and A.J.Frost, the most famous followers of the classic theory and authors of the most popular books about the Elliott Wave theory, wrote “we prefer the less connotative term, “truncation,” or “truncated fifth.”
I think I have provided enough reasons that can make you question useless of the classic Elliott Wave theory in the real life trading. In my next article I will explain in details what Harmonic Elliott Wave theory is, how it differs from the classic Elliott Wave theory and why it is the best and the most accurate prediction tool you need to learn if you want to trade like a pro.
Trading is risky. Read this important Disclaimer
HIGH RISK WARNING
Trading stocks, options, or futures carries a high level of risk, and may not be suitable for all investors. Before deciding to trade, you should carefully consider your objectives, financial situation, needs and level of experience. CastAway Trader LLC provides general overview of trading methods that does not take into account your objectives, financial situation or needs. The content of this website must not be construed as personal advice. The possibility exists that you could sustain a loss in excess of your deposited funds and therefore, you should not speculate with capital that you cannot afford to lose. You should be aware of all the risks associated with trading. You should seek advice from an independent financial advisor. Past performance is not necessarily indicative of future success.