• Home
  • US Market Updates
  • Education
    • Beginners Video Course
    • Intermediate Video Course
      • Syllabus of the Course
    • Trading Like A Pro Video Course
    • Video Lesson of the Week
  • Blog
  • Chat Room
  • Pricing
  • FAQ
Menu
  • Home
  • US Market Updates
  • Education
    • Beginners Video Course
    • Intermediate Video Course
      • Syllabus of the Course
    • Trading Like A Pro Video Course
    • Video Lesson of the Week
  • Blog
  • Chat Room
  • Pricing
  • FAQ

AAL - gorgeous textbook LONG setup

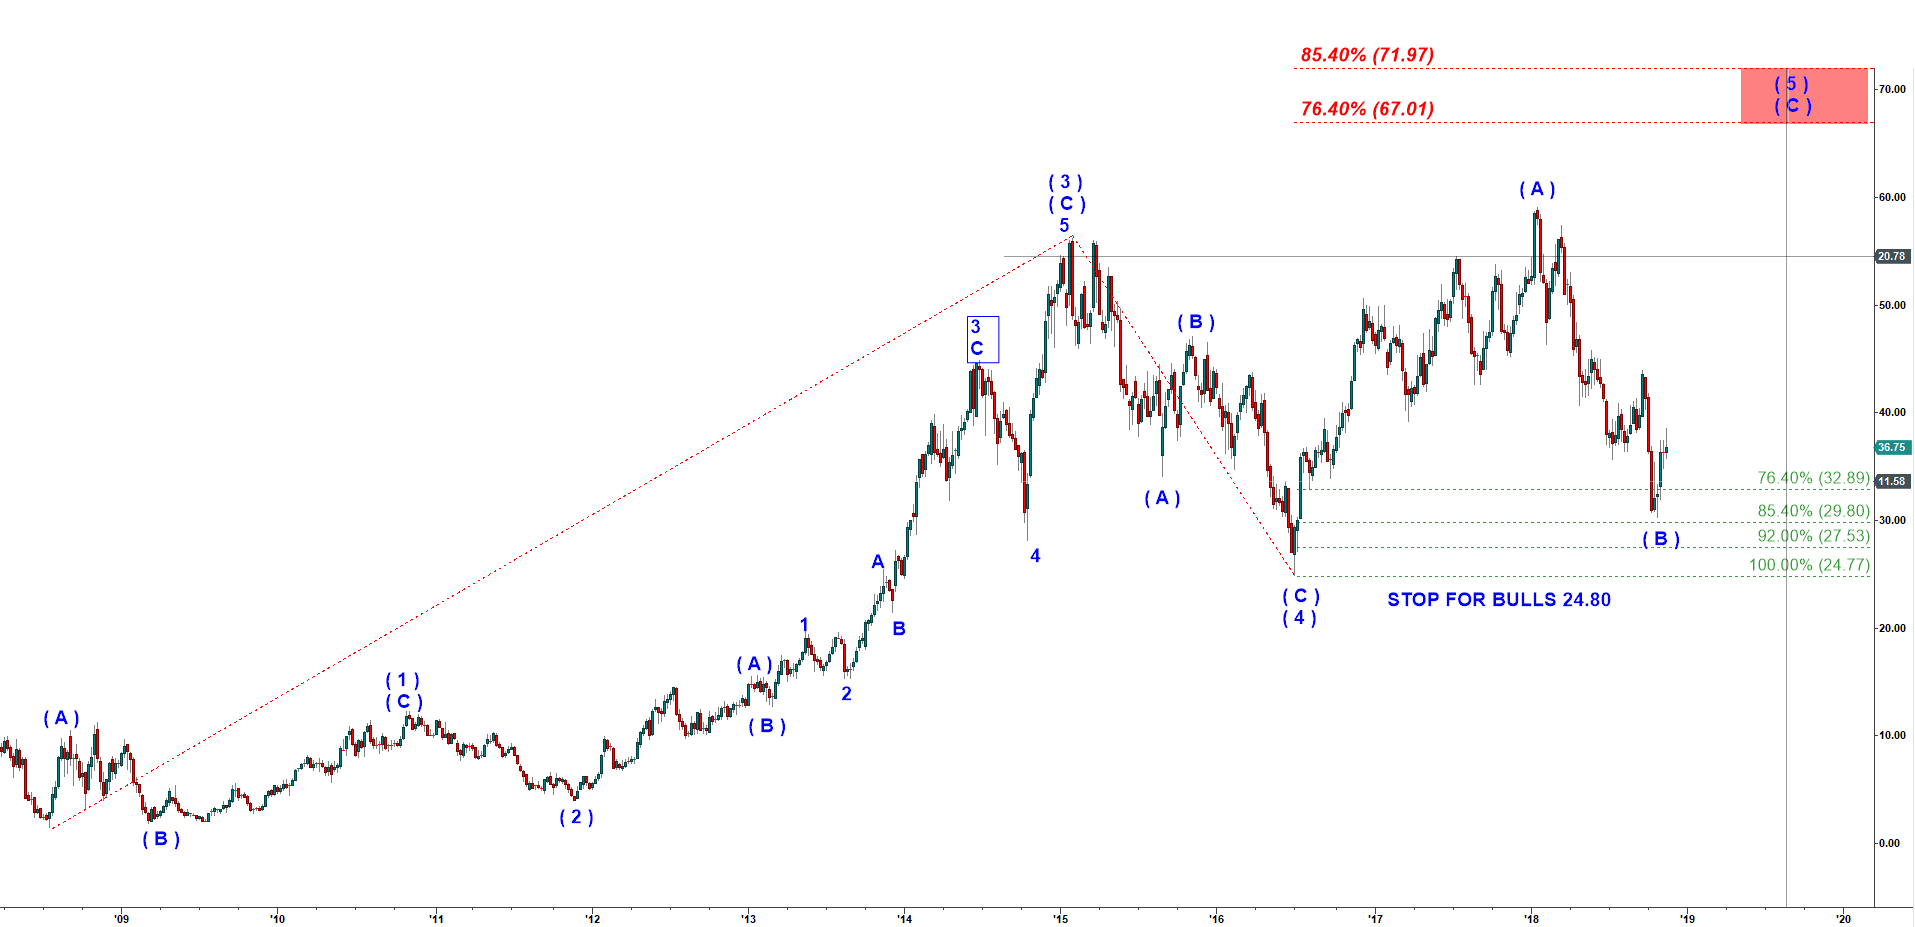
I count the rally that have been unfolding off 2009 low as an impulsive five wave up structure. It has been following a textbook structure very well. The rally that topped in January 2018 looks like a classic wave ( A ) of ( 5 ). The following corrective looking decline looks like a classic wave ( B ) of ( 5 ). As long as it stays over the low of the wave ( 4 ) down at 24.85 we should expect a multi month rally in wave ( C ) of ( 5 ) to the red target area $67-$72.

AAL - Daily chart updated on 17 November 2018

Tags
$ES $SPX a-b-c- up pullback a-b-c up Bearish reversal Bear Market Rally Bitcoin Bottoming Breakdown breakout Bullish Wedge Crude Oil Daily Double Three DXY ES Expanded Flat Expanding Triangle failed breakdown failed breakout Green Box Head and Shoulders i down - ii up setup Inverse Head and Shoulders i up - ii down setup Macro micro Month Opening Range NQ one more high one more higher high Red Box RTY Running Flat S&P short setup SPX topping toppying trading setup triangle Triple Three weekend Weekly YM
Read my Blog

  • My Account
  • Login
Hestia | Developed by ThemeIsle