Skip to content
  • Home
  • US Market Updates
  • Indicators
    • Impulse Master
    • Cycle Trader
    • GANN Levels
    • Subscribe
  • Education
    • Beginners Video Course
    • Intermediate Video Course
      • Syllabus of the Course
    • Trading Like A Pro Video Course
    • Video Lesson of the Week
  • Chat Room
  • Pricing
  • FAQ
  • My Account
  • Login

Subscription: Access to Micro Counts of US indices

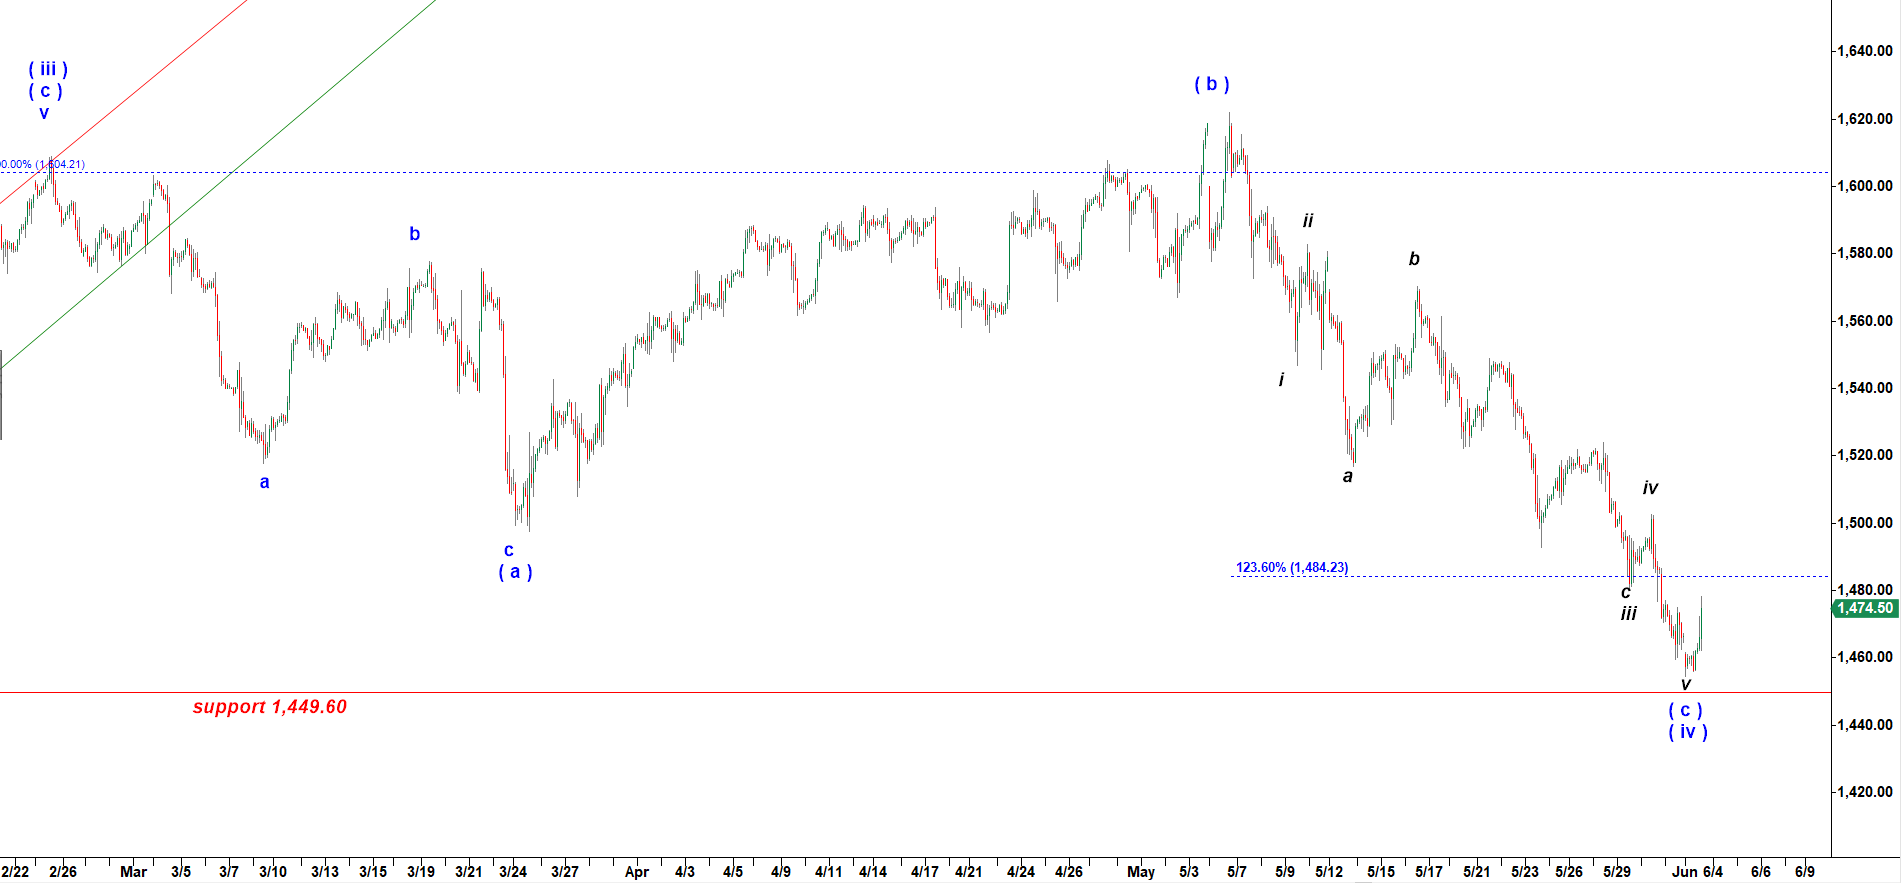
RTY has held over the critical support at 1,449.60

It looks having completed a large corrective wave ( iv ) down after a strong rally in wave ( iii ) up.
As long as it holds over 1,449.60 we may expect a rally in wave ( a ) of ( v ) targeting the previous top in 1,600 neighborhood.

RTY - 120 min chart updated at 11:28 AM on 6/3/2019

Disclaimer

Previous posts:

No posts found.
© 2025 CastAway Trader • Built with GeneratePress