Skip to content
  • Home
  • US Market Updates
  • Indicators
    • Impulse Master
    • Cycle Trader
    • GANN Levels
    • Subscribe
  • Education
    • Beginners Video Course
    • Intermediate Video Course
      • Syllabus of the Course
    • Trading Like A Pro Video Course
    • Video Lesson of the Week
  • Chat Room
  • Pricing
  • FAQ
  • My Account
  • Login

Subscription: Access to Micro Counts of US indices

ES the bearish setup is alive

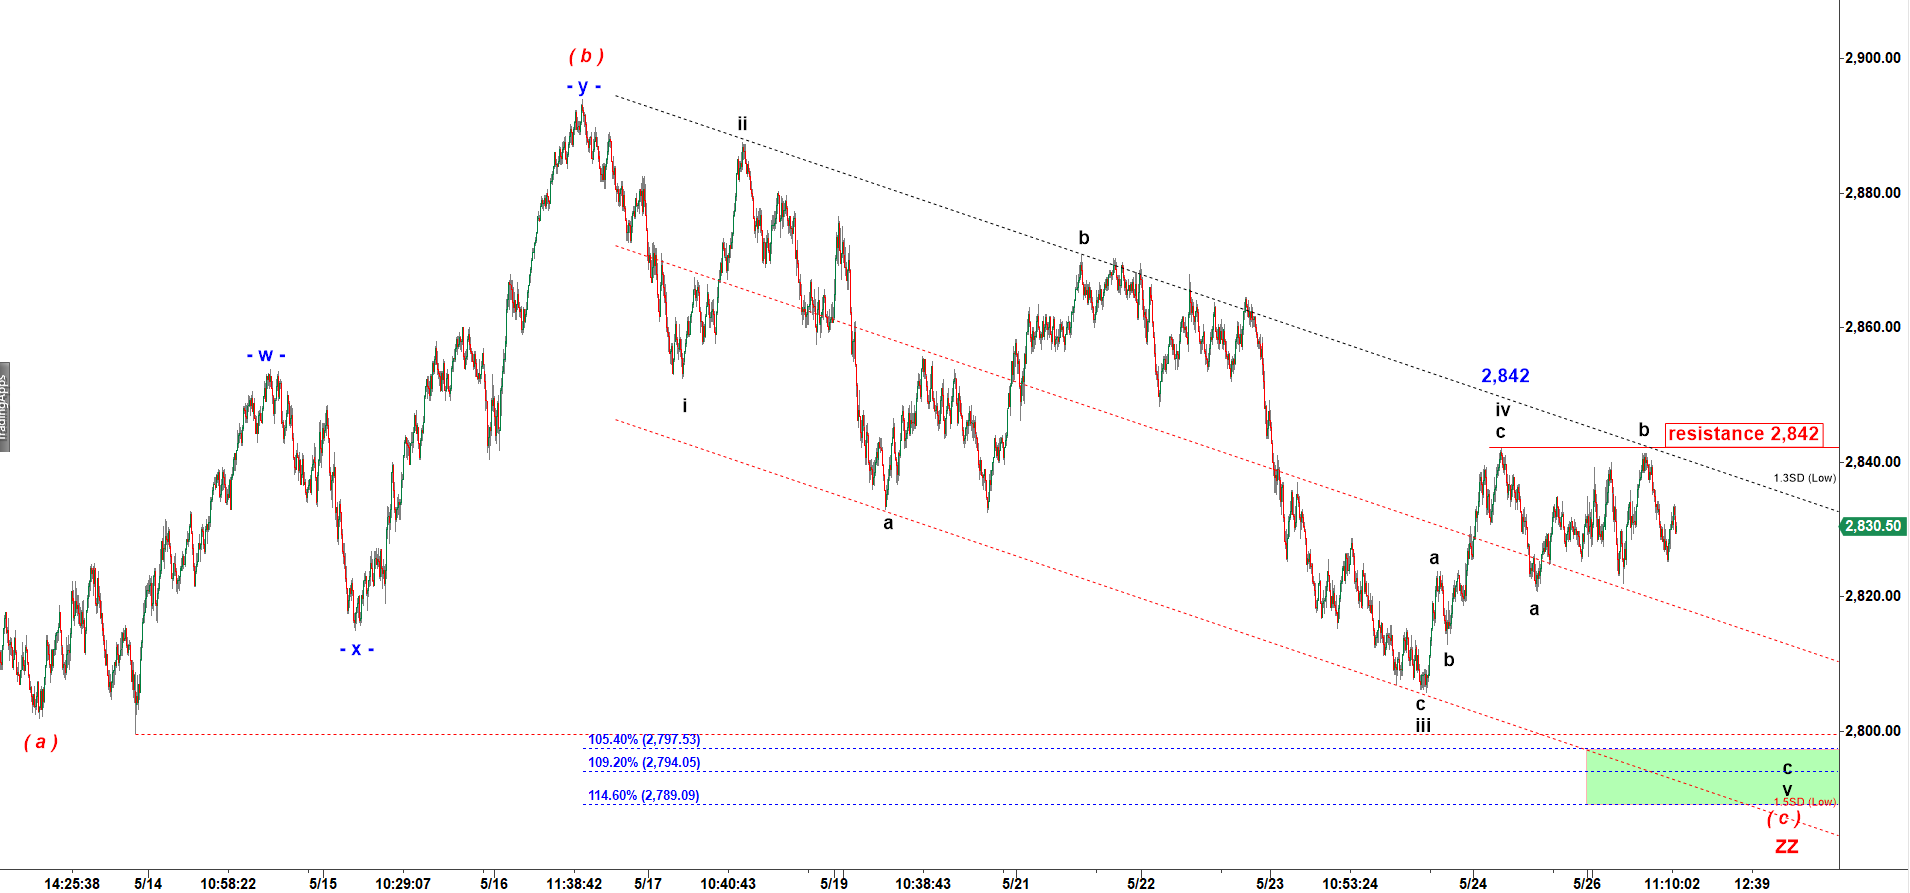
The rally off the low made at 2,820.75 last Friday looks ugly. Exactly how a corrective wave b up is supposed to look. It stretched to 2,841.25 but could not reach to the top of wave iv up (2,842). As long as ES stays under 2,842 I maintain my bearish bias and expectation for another drop in wave c down.

ES - 4,500 tick bar chart at 11:24 AM on 5/28/2019

Disclaimer

Previous posts:

No posts found.
© 2025 CastAway Trader • Built with GeneratePress