Skip to content
  • Home
  • US Market Updates
  • Indicators
    • Impulse Master
    • Cycle Trader
    • GANN Levels
    • Subscribe
  • Education
    • Beginners Video Course
    • Intermediate Video Course
      • Syllabus of the Course
    • Trading Like A Pro Video Course
    • Video Lesson of the Week
  • Chat Room
  • Pricing
  • FAQ
  • My Account
  • Login

Subscription: Access to Micro Counts of US indices

ES - maintain bearish bias

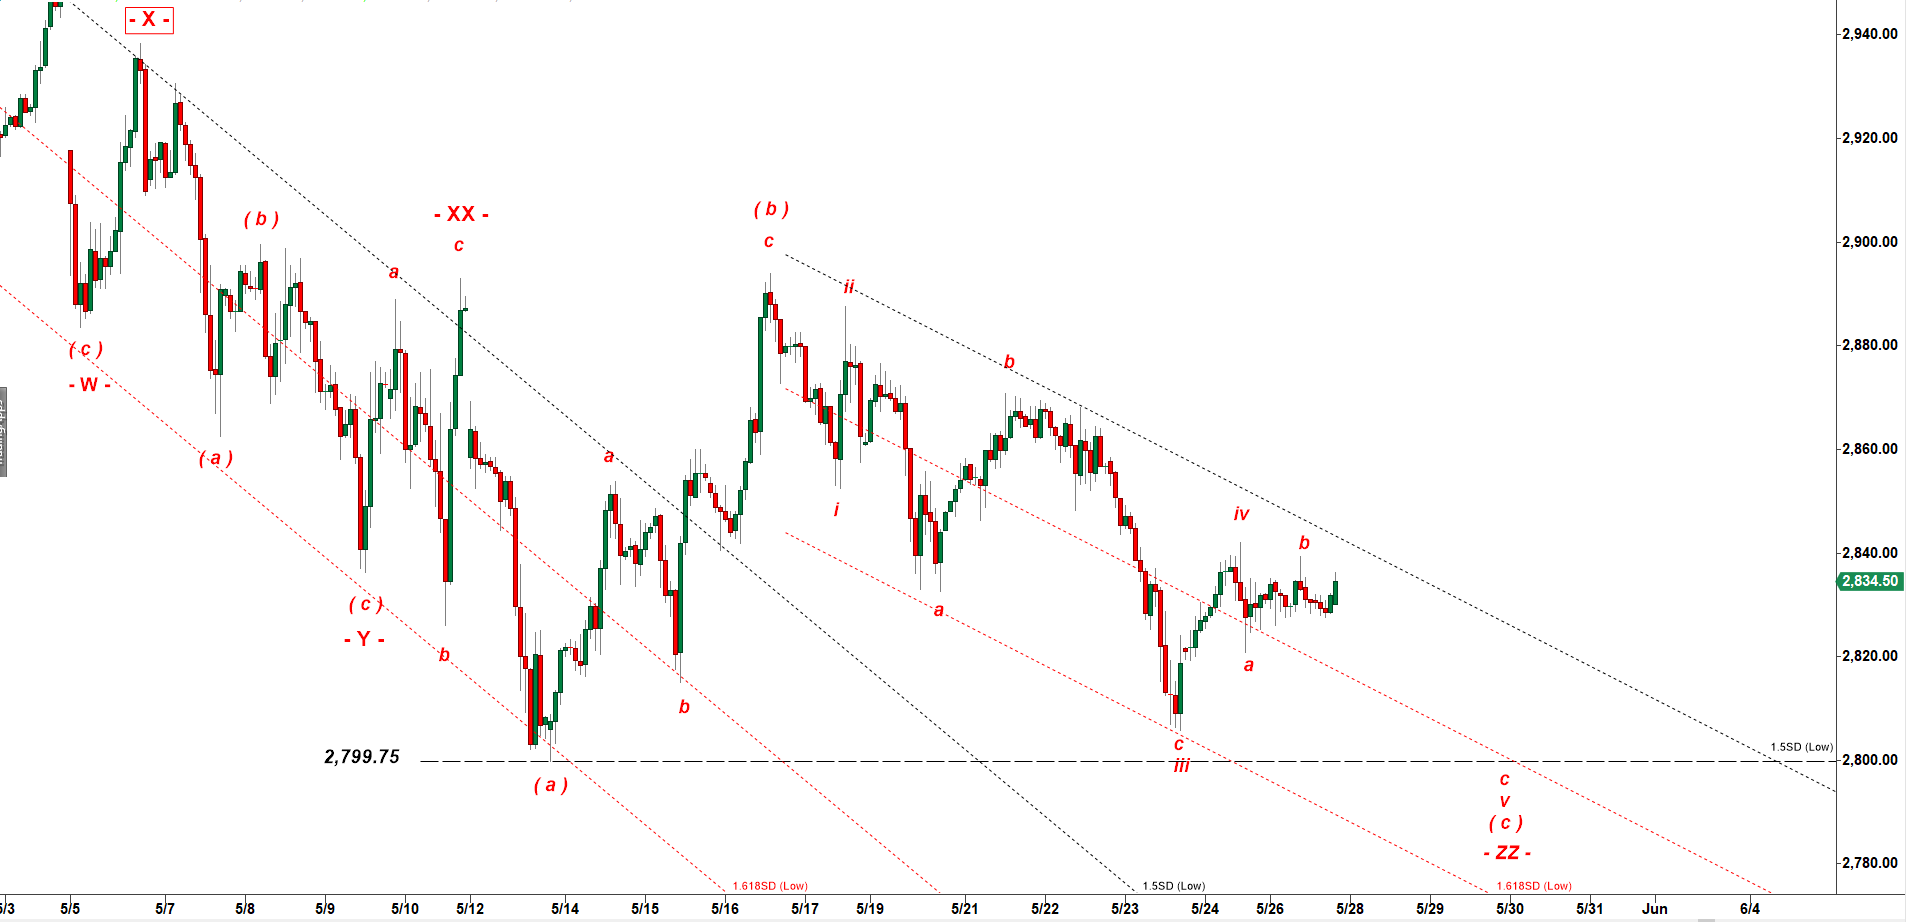
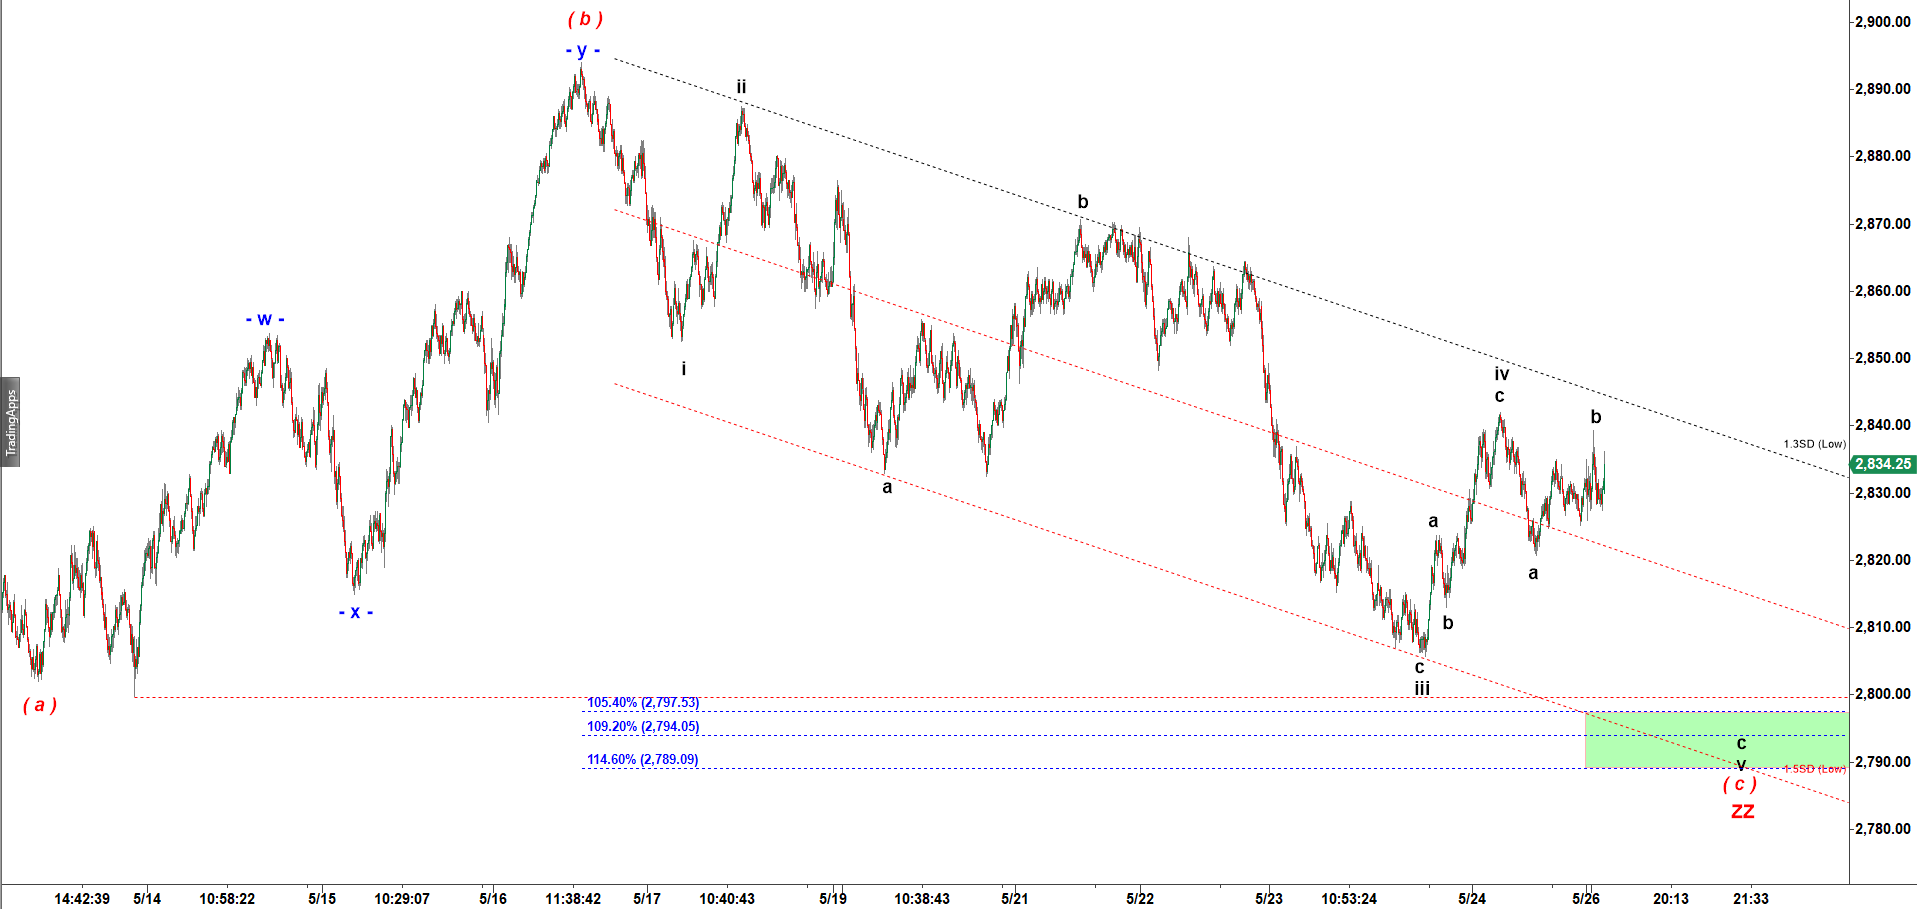
As I noted in the previous update, I expect another drop in wave c of v down.
We keep watching the very same triple three corrective structure started off the top made on 1 May 2019.
We are left with the very final push down in wave c of v of ( c ) of ZZ of ( B ) down before start of another rally in a large wave ( C ) up.

ES - 90 min chart at 7:09 PM on 5/27/2019

That wave b up may stretch a bit higher to 2,840 but its erratic micro structure only confirms its a corrective wave b up setting a stage for a drop in wave c down.

ES - 4500 tick bar chart at 7:09 PM on 5/27/2019

Disclaimer

Previous posts:

No posts found.
© 2025 CastAway Trader • Built with GeneratePress