Below you can read a report that I sent to my subscribers at 3:15 PM on Sunday, May 26th, 2019. In the report I reaffirmed my bearish expectations:
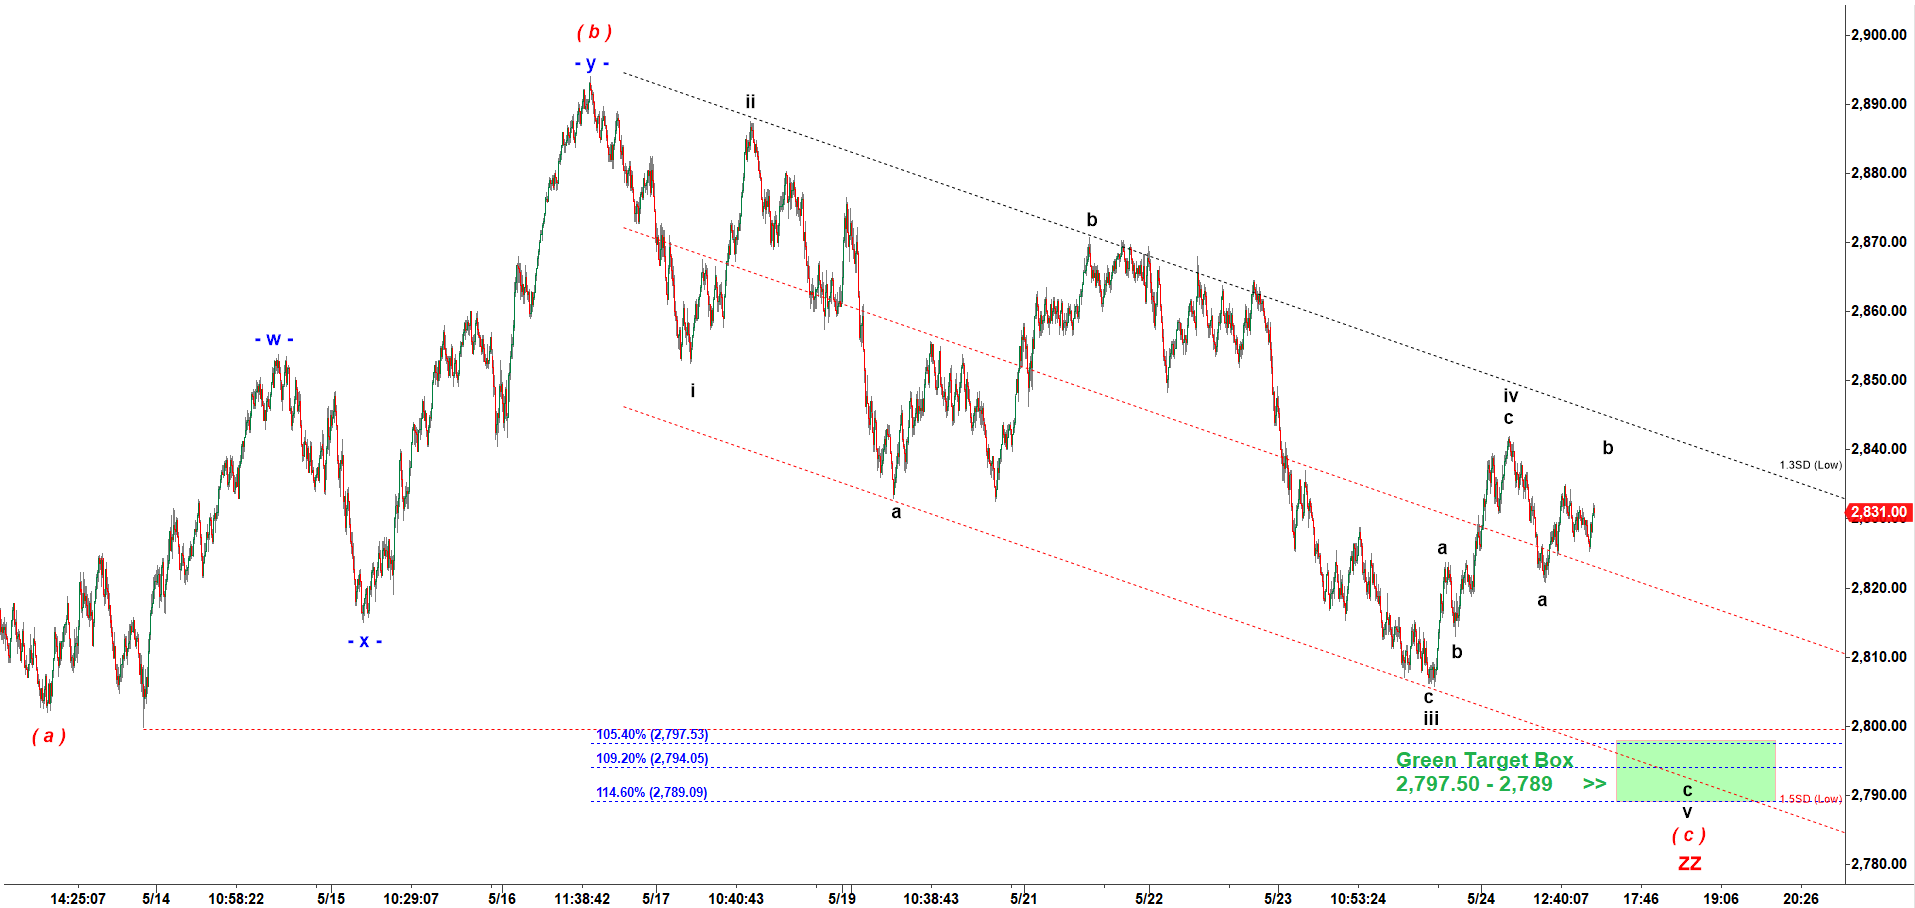
“At Friday close we had wave b up going up. It may open higher next week. It may even stretch a bit higher over the top of wave iv up at 2,842. But then we should get the final decline in subwave c of v down targeting a lower low under the low of wave iii down ( 2,805.75 ).”
In full accordance to my prediction, ES opened higher and topped at 2,841.25 and then dropped to 2,802.50!
Subscription: Access to Micro Counts of US indices
ES - still expect another decline to make a lower low under 2,800
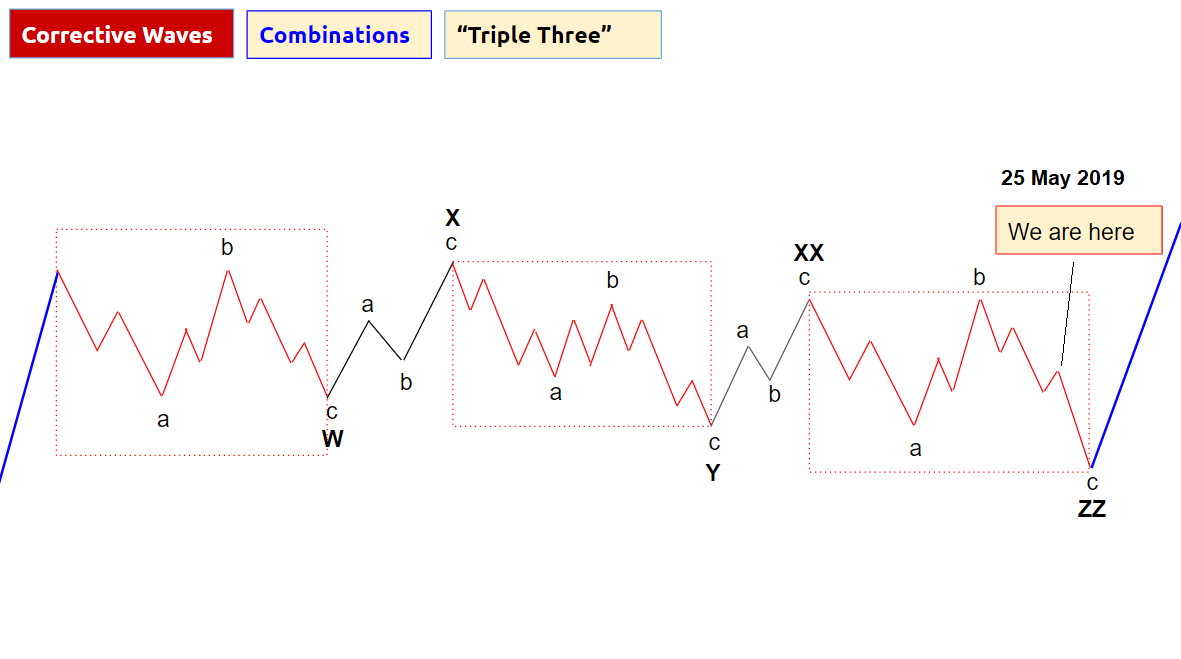
We keep watching the “Triple Three” corrective fractal started off the top made on 1 May 2019. To complete that fractal we should get an extension of this decline in the final wave ( c ) of ZZ that ideally should make a new lower low under 2,800.
That final decline in wave ( c ) of ZZ should be subdivided into five waves. Last week we completed a corrective wave iv up (see the chart below). The very final wave v down should be structured as a down – b up – c down. At Friday close we had wave b up going up. It may open higher next week. It may even stretch a bit higher over the top of wave iv up at 2,842. But then we should get the final decline in subwave c of v down targeting a lower low under the low of wave iii down ( 2,805.75 ).
ES - 4,500 tick bar chart at 10:55 AM on 5/26/2019