Skip to content
  • Home
  • US Market Updates
  • Indicators
    • Impulse Master
    • Cycle Trader
    • GANN Levels
    • Subscribe
  • Education
    • Beginners Video Course
    • Intermediate Video Course
      • Syllabus of the Course
    • Trading Like A Pro Video Course
    • Video Lesson of the Week
  • Chat Room
  • Pricing
  • FAQ
  • My Account
  • Login

Subscription: Access to Micro Counts of US indices

ES - the same bearish picture

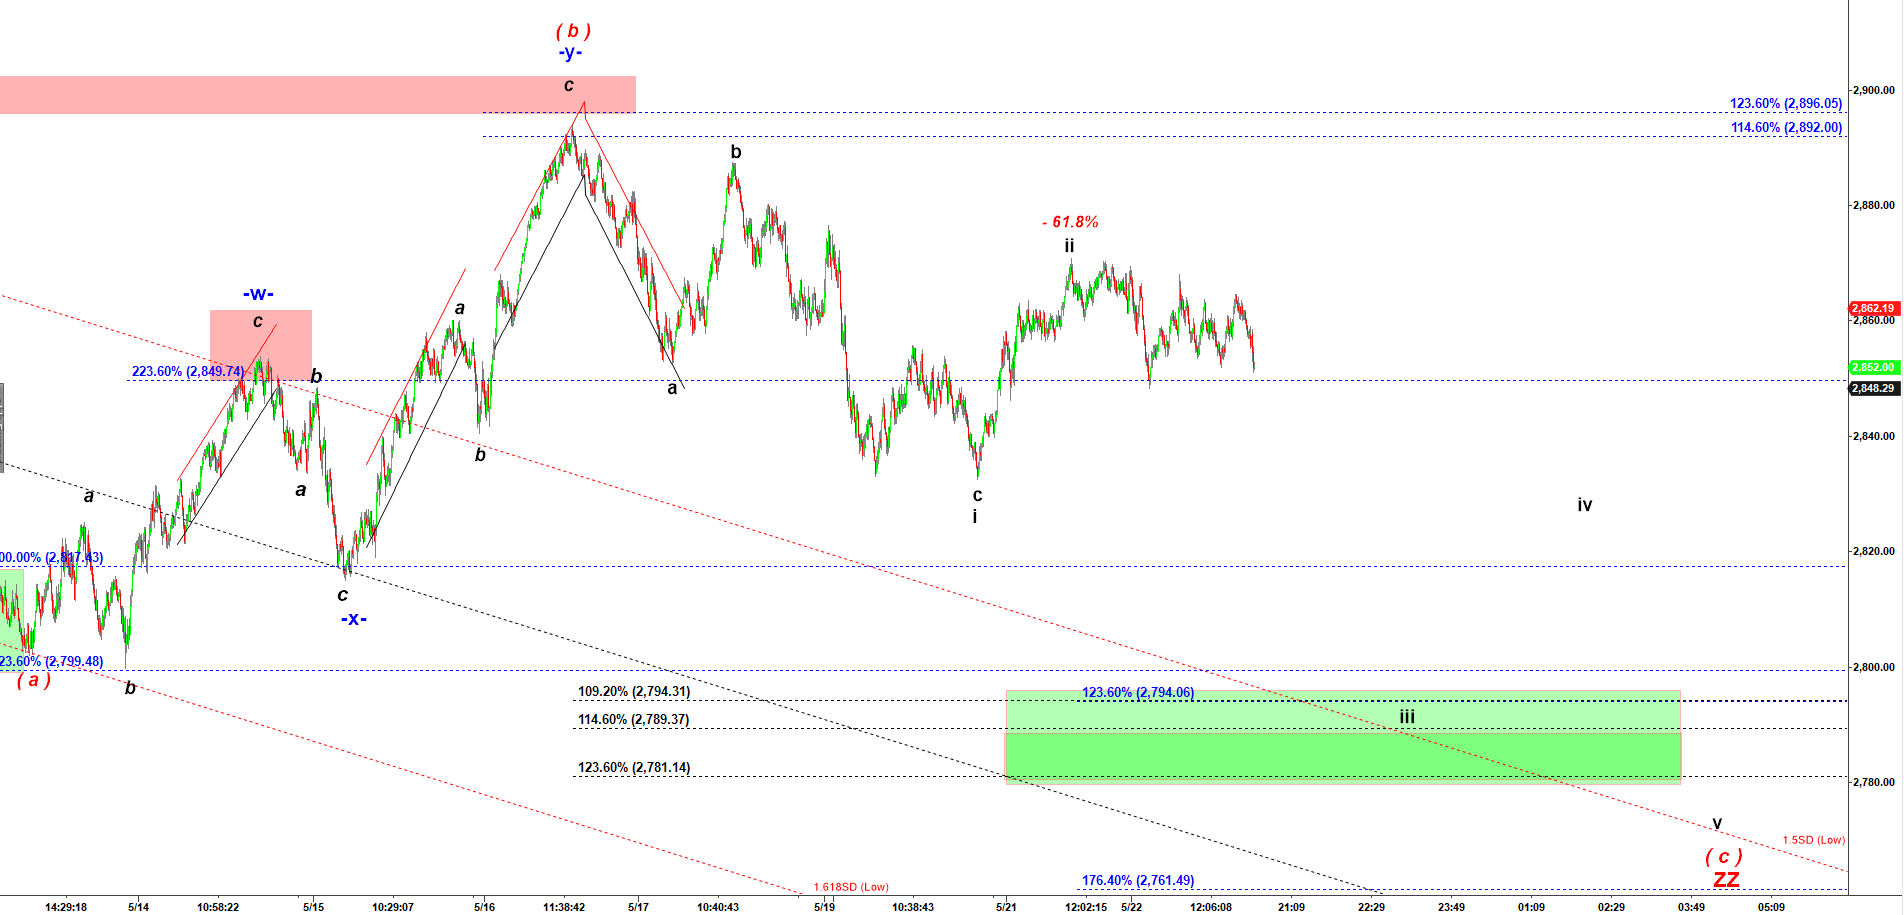
My count for ES is unchanged. We have wave i down followed by a corrective wave ii up.
The next one should be a drop in wave a of iii. I am focusing on 2,795, 123.6% extension of wave i. This is where wave iii down may find a bottom before a pullback in wave iv up.

ES - 4,500 tick bar chart at 8:33 PM on 5/22/2019

Disclaimer

Previous posts:

No posts found.
© 2025 CastAway Trader • Built with GeneratePress