Skip to content
  • Home
  • US Market Updates
  • Indicators
    • Impulse Master
    • Cycle Trader
    • GANN Levels
    • Subscribe
  • Education
    • Beginners Video Course
    • Intermediate Video Course
      • Syllabus of the Course
    • Trading Like A Pro Video Course
    • Video Lesson of the Week
  • Chat Room
  • Pricing
  • FAQ
  • My Account
  • Login

Subscription: Value Stocks

UTHR - dropped too low

On 8 April 2019 I posted an original report on UTHR. The count expected a completion of correction of the wave ( 4 ) down shaped as a symmetrical triangle. 

UTHR - weekly chart updated on 4/8/2019

Sub Value

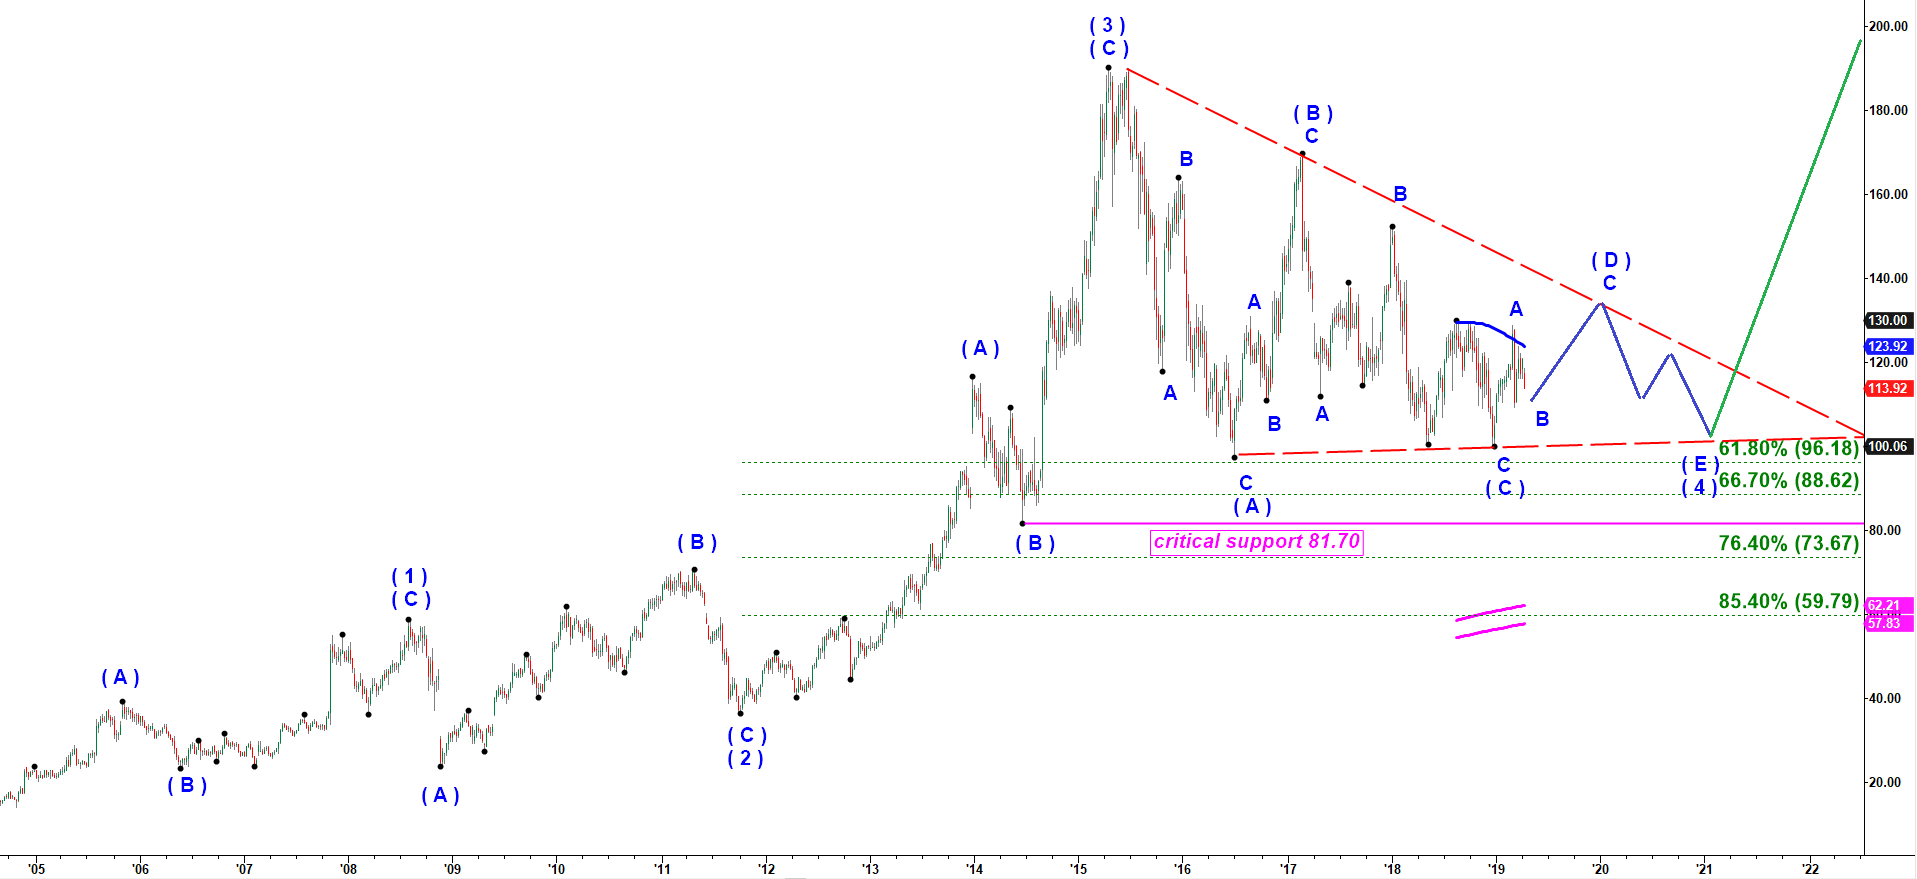
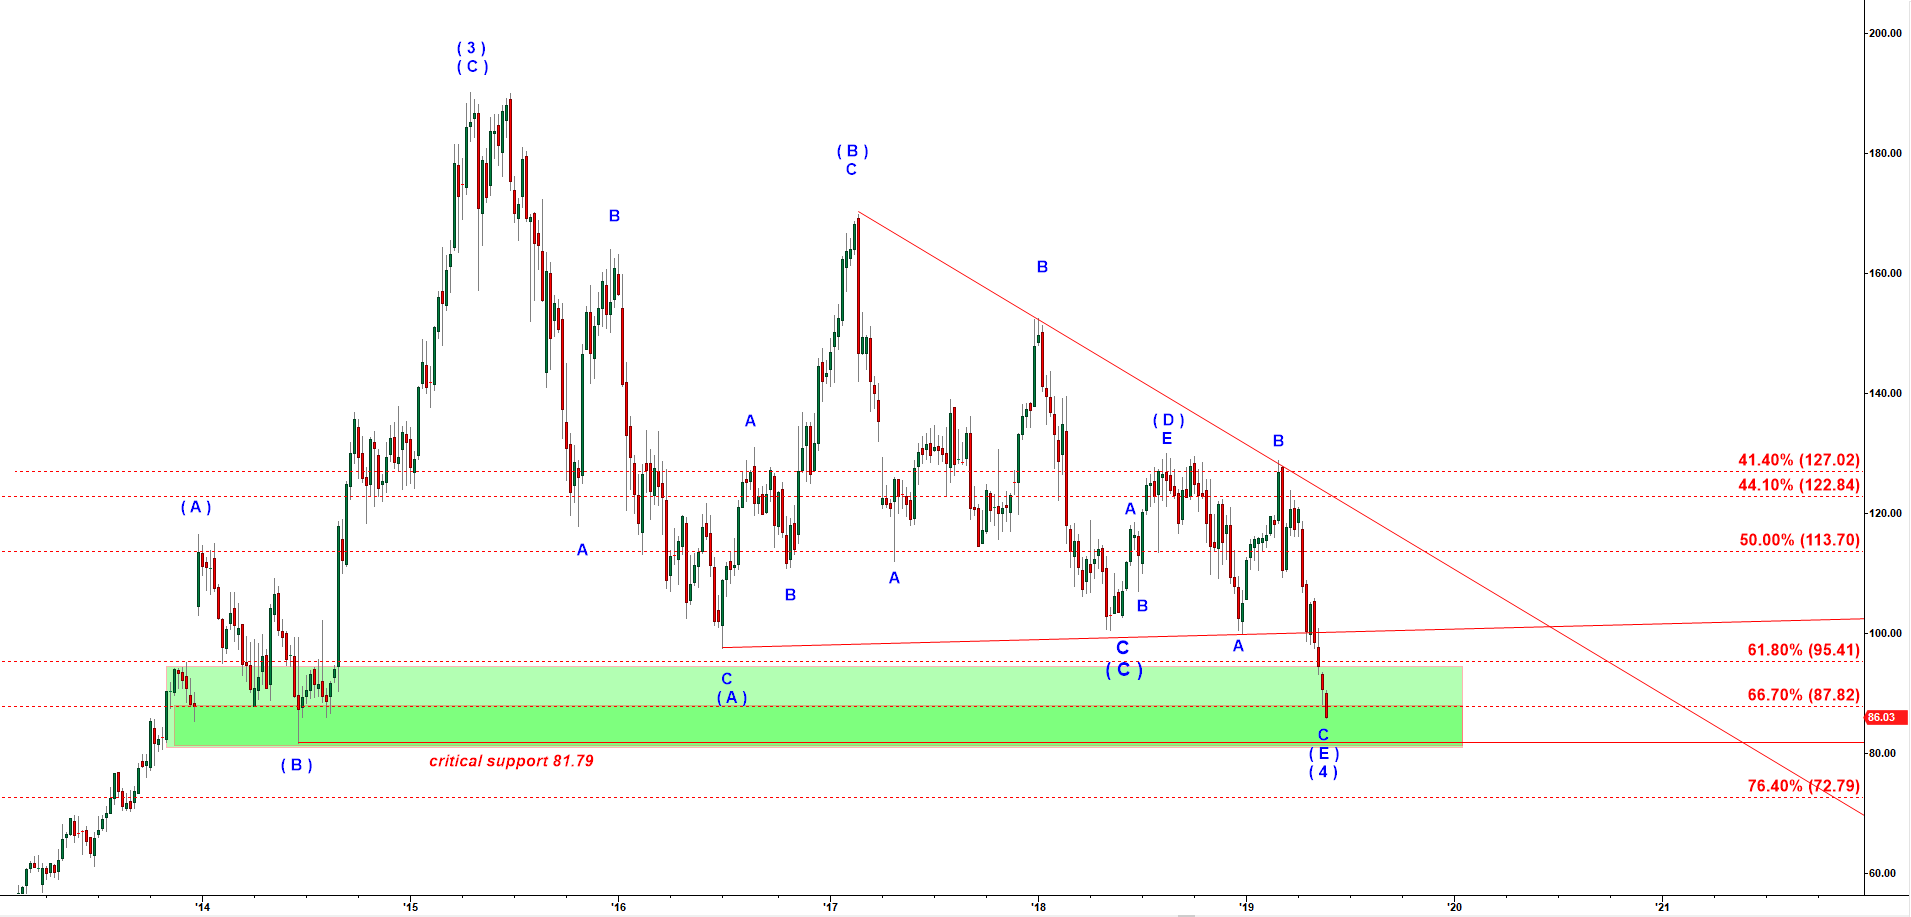
Let’s look below on the updated chart. Theoretically we still can count that correction as a triangle.  Sometimes the final wave E of the triangle breaks under support. But that move down makes that setup less reliable LONG setup. The critical support for this long setup is the low of the wave ( B ) down at 81.79. As long as price stays over that level the stock has a potential for another rally in wave ( 5 ) up. If you are not long this stock I would recommend you not to go long here. I would wait for a move up out off that green demand zone followed by a corrective micro a-b-c down.

UTHR - weekly chart updated on 5/22/2019

© 2025 CastAway Trader • Built with GeneratePress