Subscription: Micro Counts of Crude Oil & Nat Gas
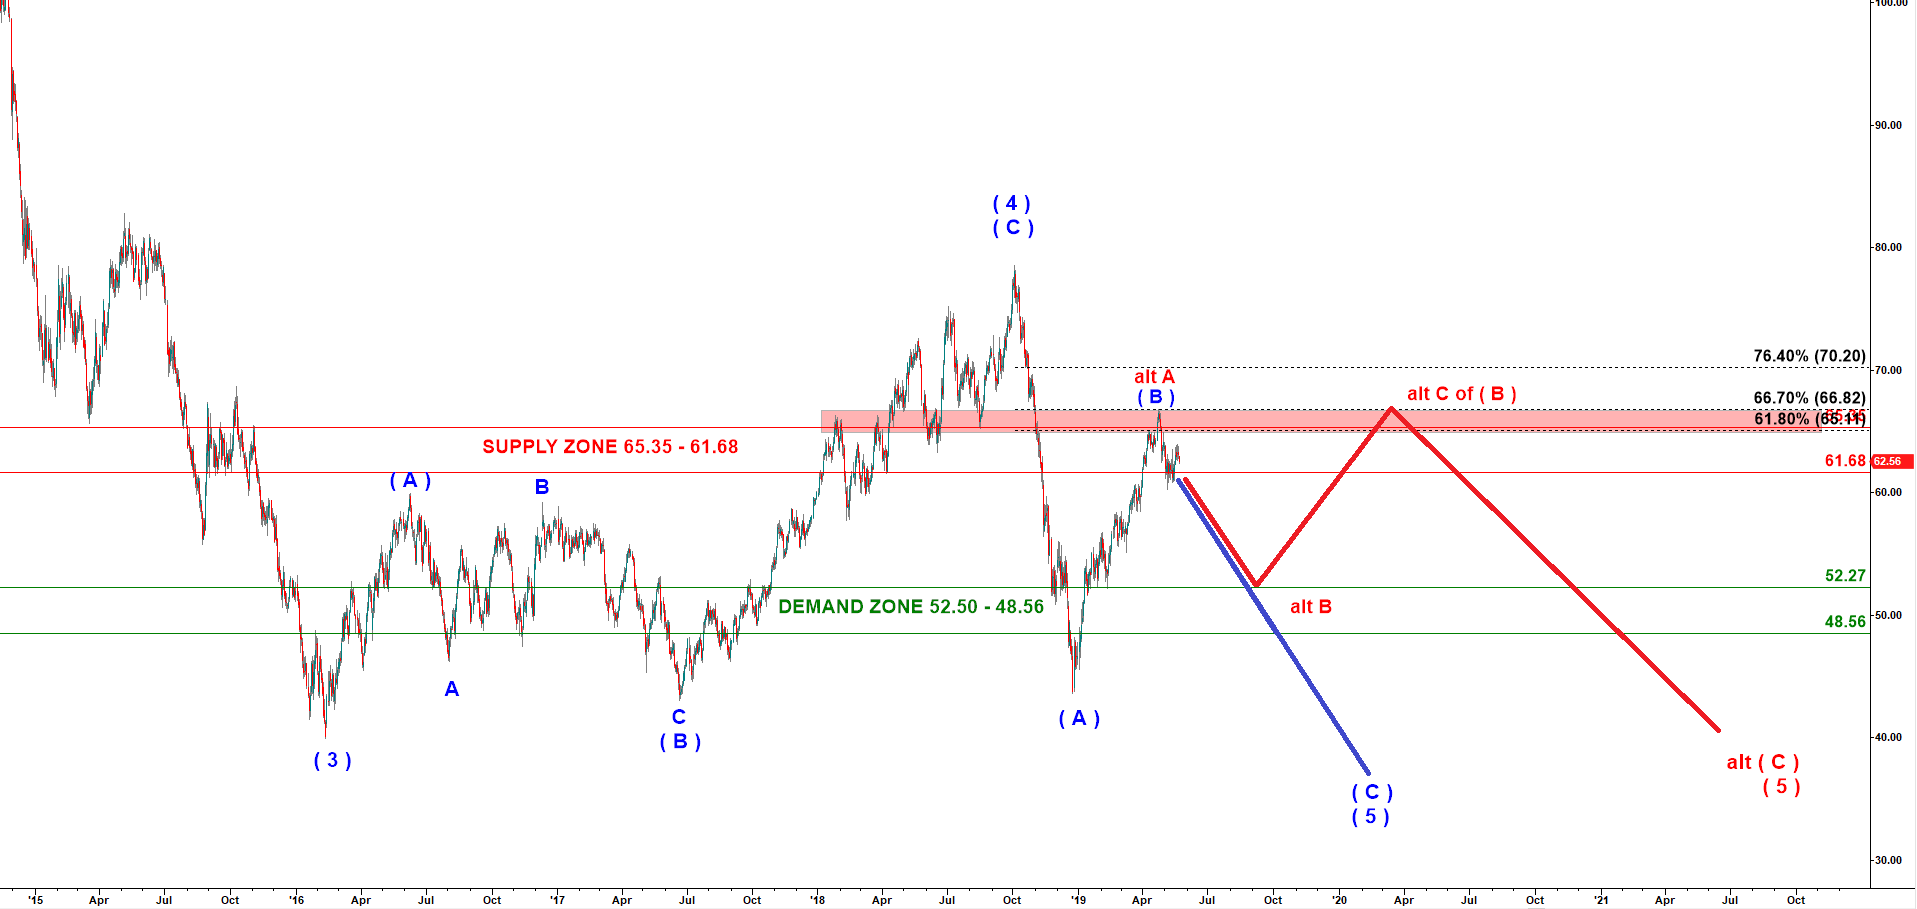
Crude - structure of the move down off the April top
In my last macro update posted on 10 April 2019 I shared my bearish expectations. I count the drop off the top made at 78.54 in October 2018 into the low at 43.59 in December 2018 as the first leg down in the wave ( A ) of ( 5 ). The rally that followed had a corrective A-B-C structure and looked like a bull trap set up by wave ( B ) up.
There is mounting evidence on the micro scale that the rally in wave ( B ) up has topped. Yesterday I wrote in my evening update: “Crude invalidated another bullish setup dropping through support at 62.60. Moreover, it has made a sequence of lower lows. That is a strong bearish sign. All bullish bets are off at this moment.”
From here we have two alternative bearish paths.
The blue path implies a direct drop to a new lower low under the lows reached in 2016. The alternative red path implies a drop to 52-48.50 and then another rally in wave C of ( B ) up.
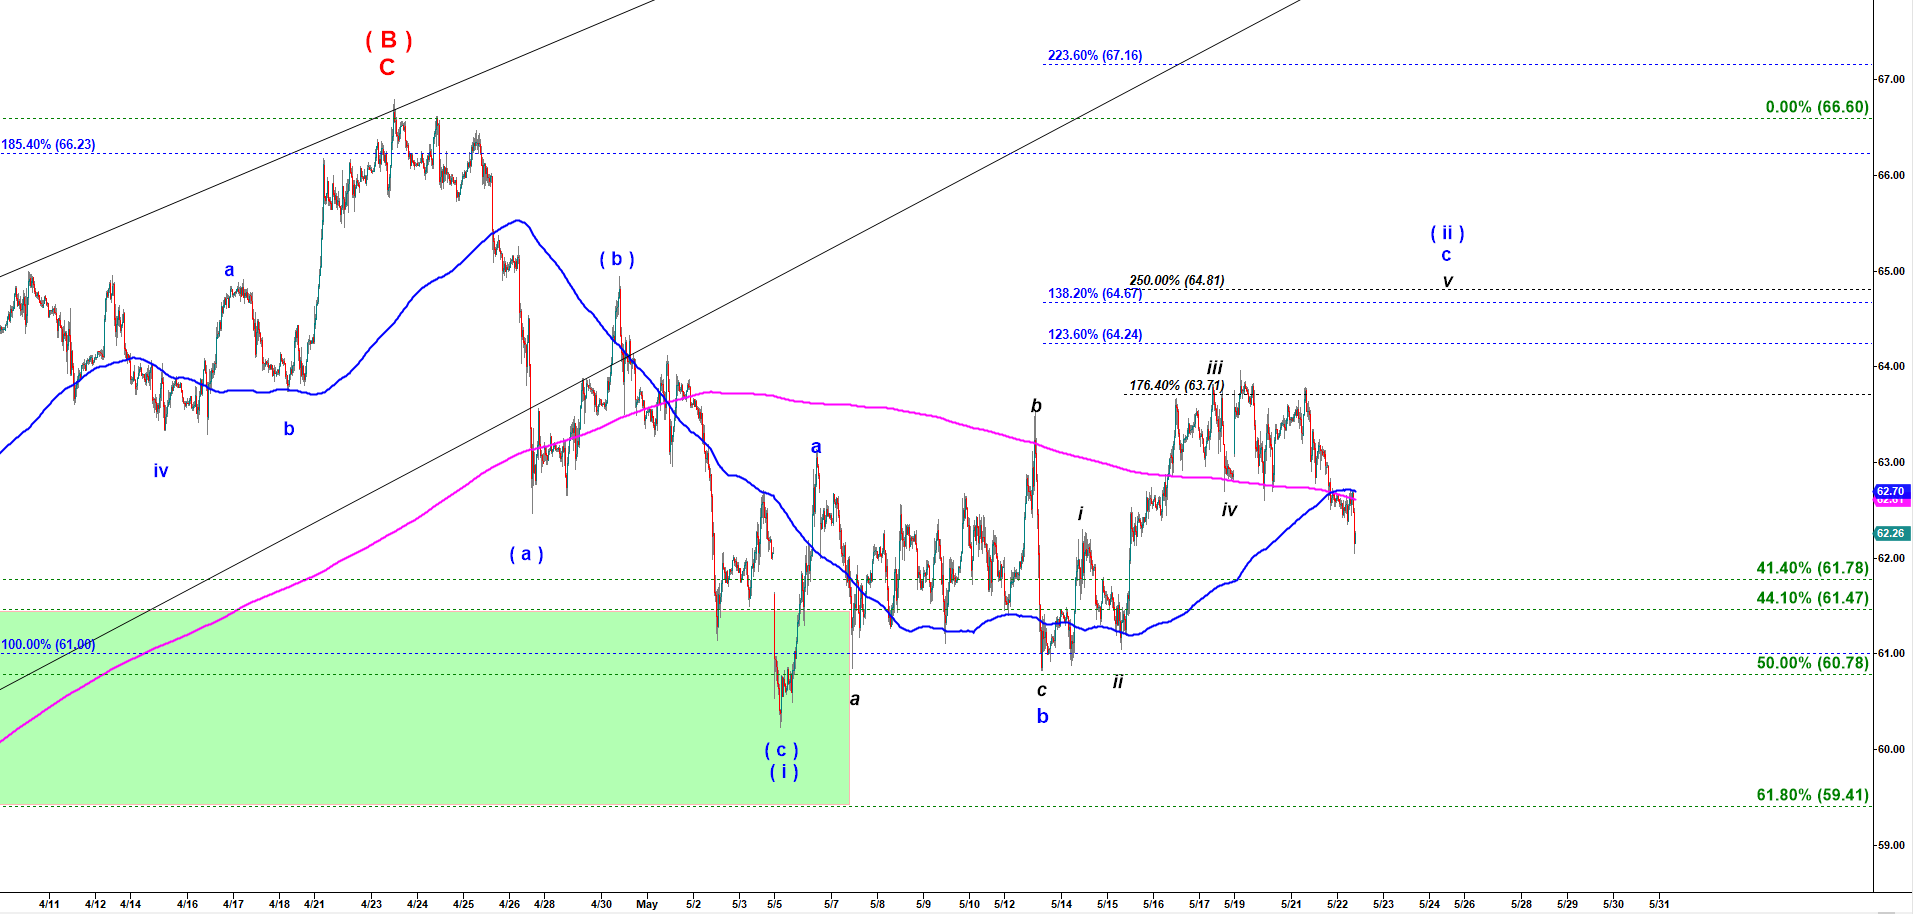
Crude oil - Daily chart updated at 8:33 AM on 5/22/2019
Off the last top made by crude at 66.79 on 23 April 2019 we have got (a)-(b)-(c) down move. that is either wave ( i ) down under the most bearish blue path on the chart above. Or wave ( a ) of B down under the less bearish red path on the chart above. The key question is whether we the following corrective a-b-c up off the low made at 60.23 on 5 May 2019 has completed. That final wave c of ( ii ) up would look better with another micro push higher. But price may drop from here without that one more high.
Crude oil - 30 min chart updated at 8:33 AM on 5/22/2019