Subscription: Access to Micro Counts of US indices
Nasdaq - has a bullish view
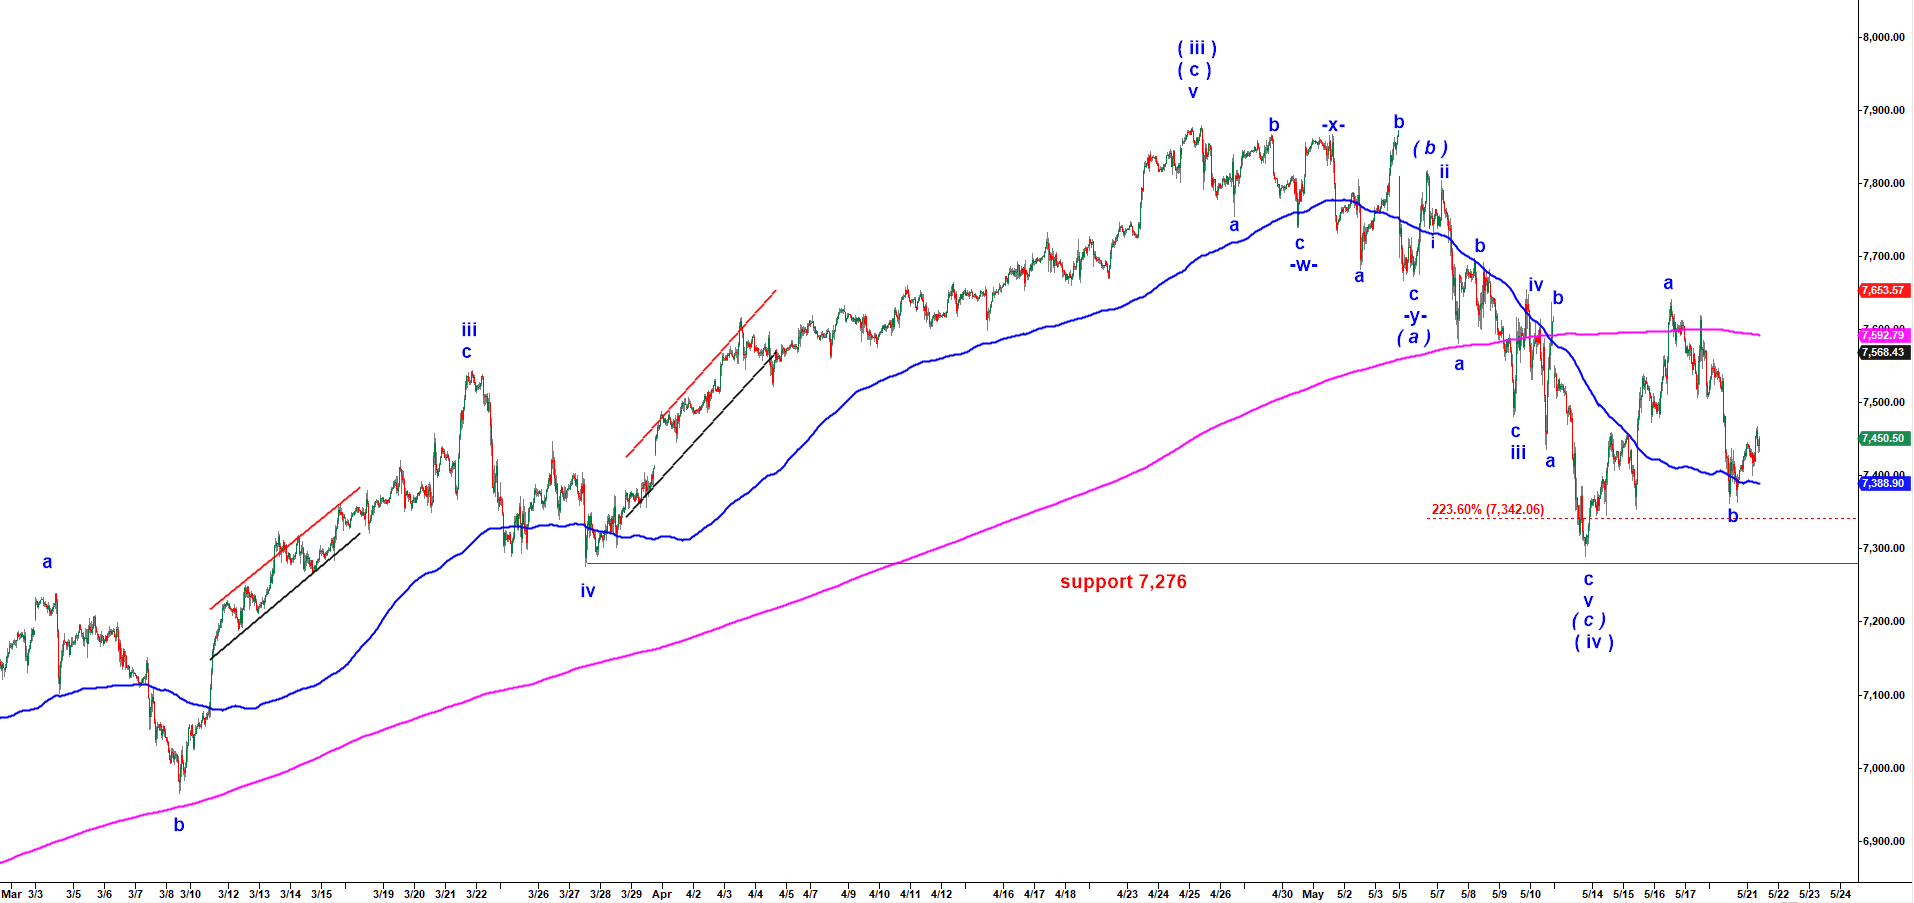
I noted last week that Nasdaq had a complete corrective structure in place. And the previous top made at 7,879.50 looked like a top of wave ( iii ) up. Then this correction off that top is a wave ( iv ) down. Note how wave ( iv ) stopped at the most common target, bottom of a previous corrective wave iv down of a lower degree.
Off the bottom at 7,290 made on 13 May 2019 we got an impulsive looking rally which I count as wave a up. Then we got a corrective looking drop which I count as b down (bottomed at 7,361.50 yesterday, 20 May 2019).
As long as the low at 7,290 holds we may get a rally in wave c up targeting at least 7,800.
NQ - 90 min chart updated at 8:59 AM on 5/21/2019
Previous posts:
No posts found.