Skip to content
  • Home
  • US Market Updates
  • Indicators
    • Impulse Master
    • Cycle Trader
    • GANN Levels
    • Subscribe
  • Education
    • Beginners Video Course
    • Intermediate Video Course
      • Syllabus of the Course
    • Trading Like A Pro Video Course
    • Video Lesson of the Week
  • Chat Room
  • Pricing
  • FAQ
  • My Account
  • Login

Subscription: Access to Micro Counts of US indices

ES - this is how extended should get another drop to deliver OML

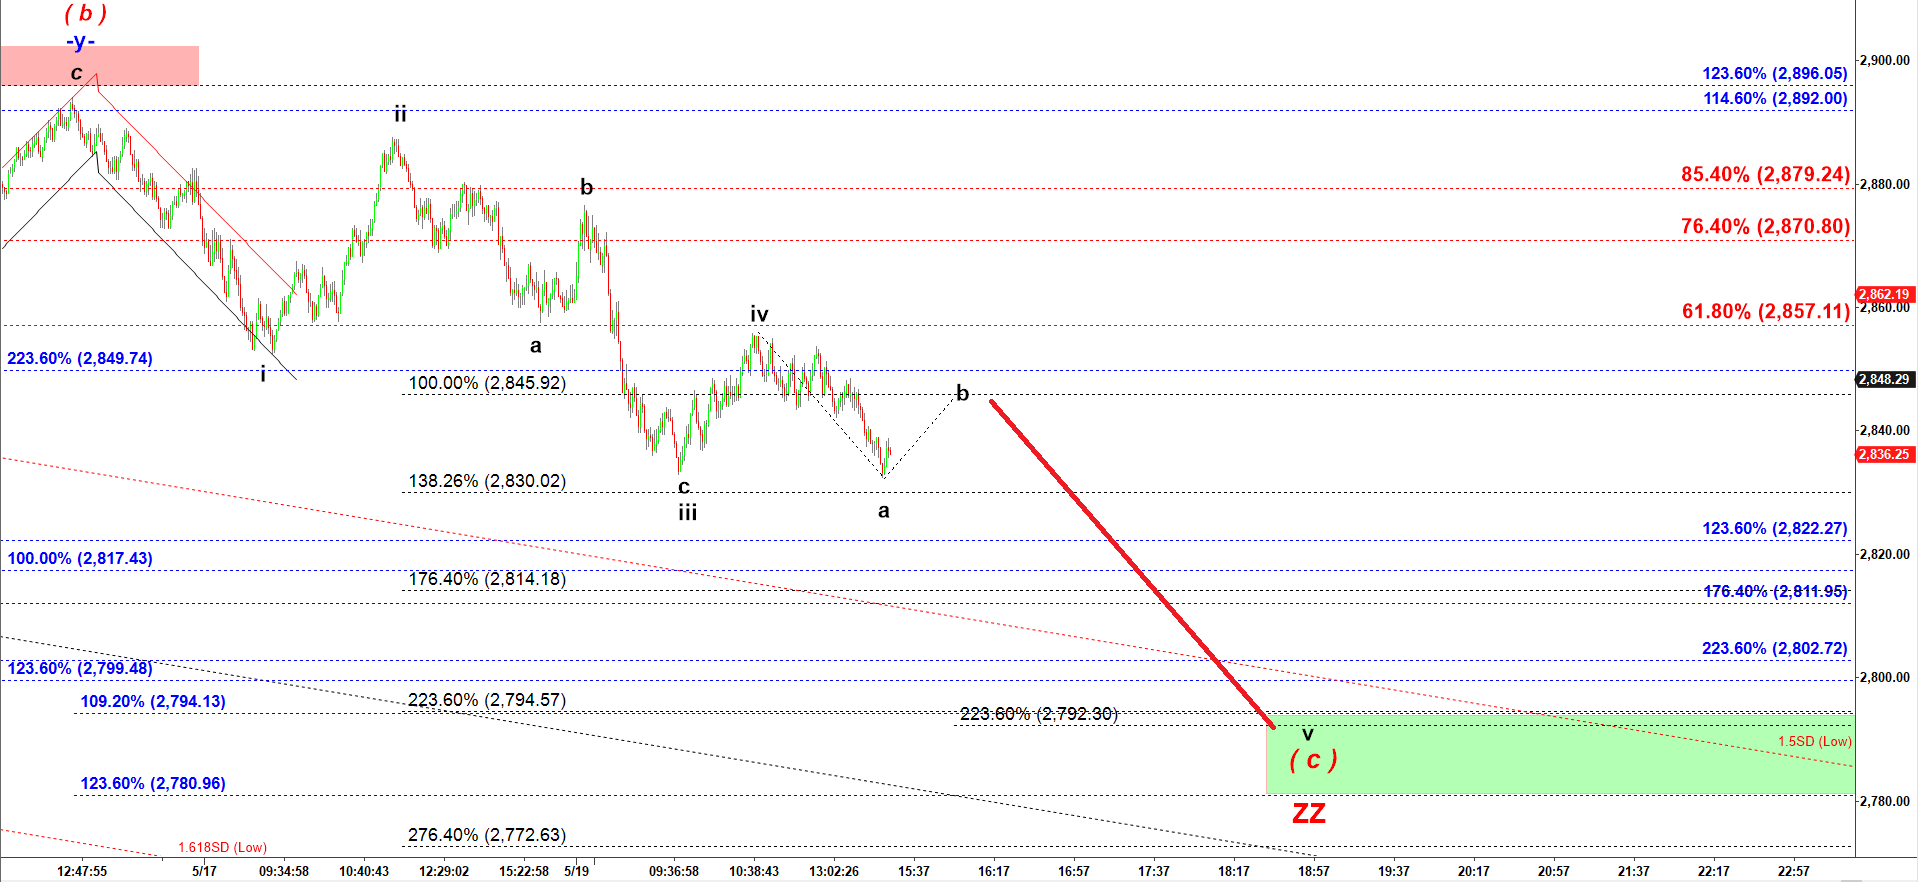
On the chart below I am showing you the scenario I am watching. That wave c of v should extend to 223.6% of wave a of v to make that one more low under 2,800 to complete the bearish count and set a stage for another rally.

ES - 4,500 tick bar chart at 3:26 PM PM on 5/20/2019

Disclaimer

Previous posts:

No posts found.
© 2025 CastAway Trader • Built with GeneratePress