Skip to content
  • Home
  • US Market Updates
  • Indicators
    • Impulse Master
    • Cycle Trader
    • GANN Levels
    • Subscribe
  • Education
    • Beginners Video Course
    • Intermediate Video Course
      • Syllabus of the Course
    • Trading Like A Pro Video Course
    • Video Lesson of the Week
  • Chat Room
  • Pricing
  • FAQ
  • My Account
  • Login

Subscription: Access to Micro Counts of US indices

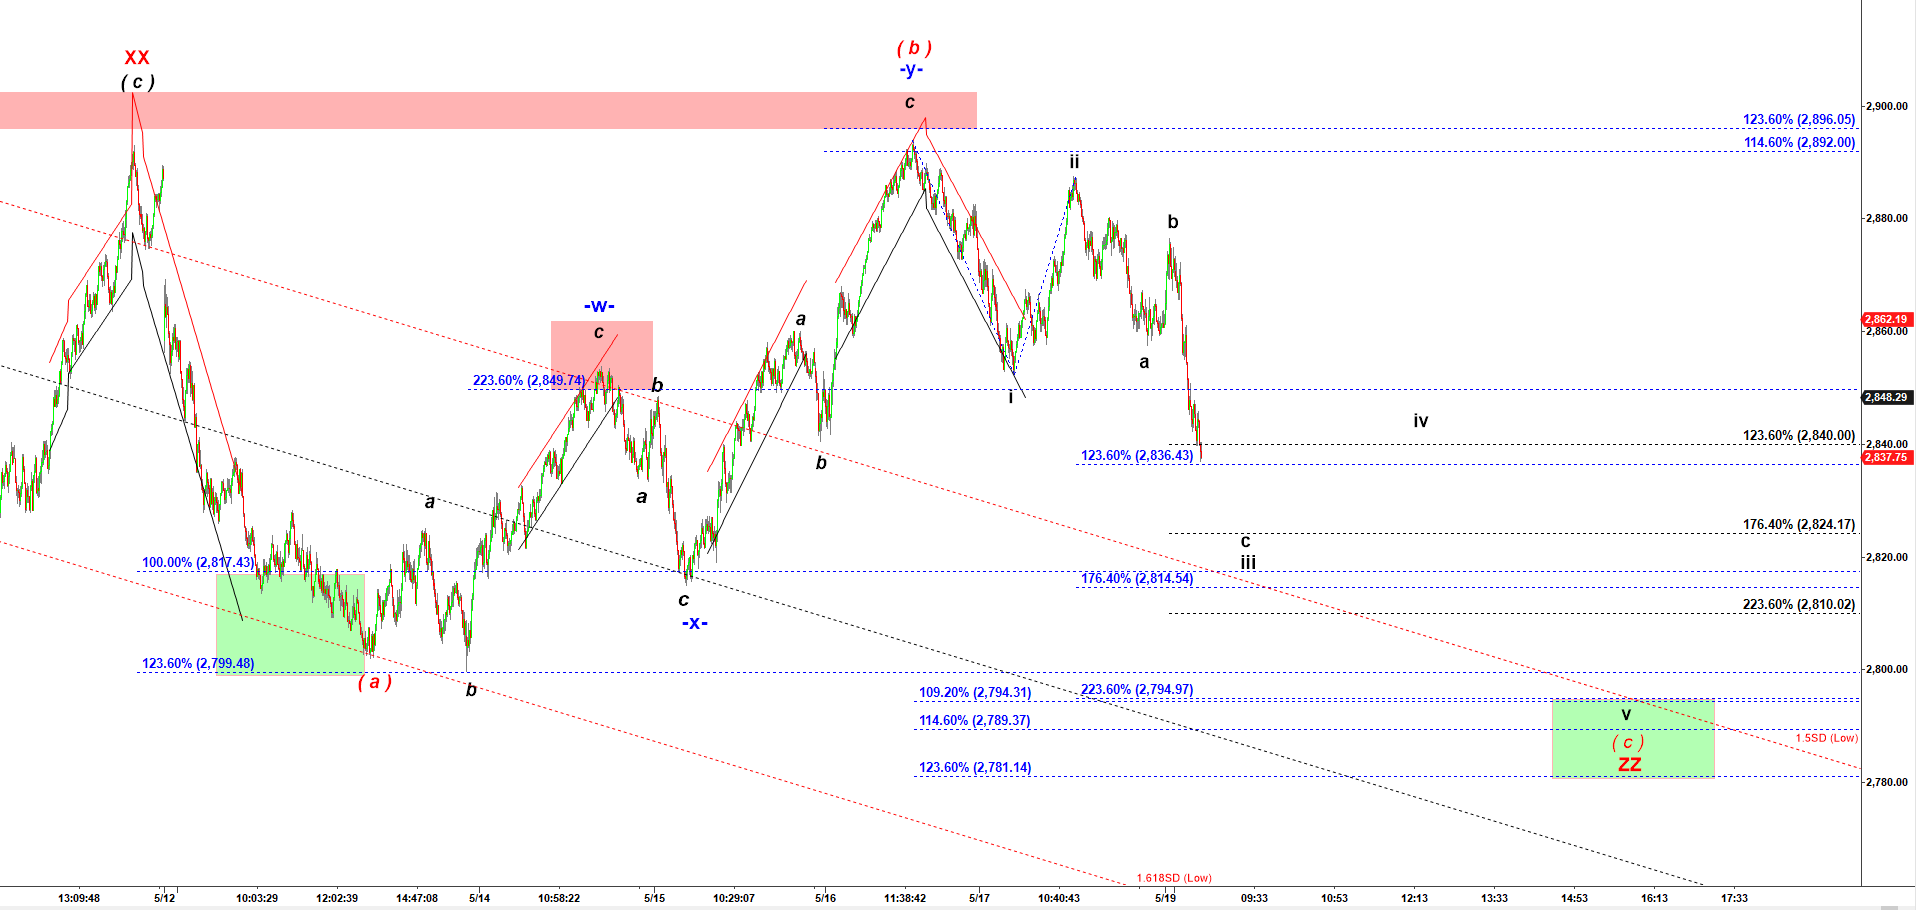
ES - keeps following my bearish count

This overnight drop looks like wave c of iii down that ideally should stretch to 2,825-2,815 before a pullback in a micro wave iv up.
The ultimate destination of that wave ( c ) down is 2,795-2,780.

ES - 4,500 tick bar chart at 8:40 AM on 5/20/2019

Disclaimer

Previous posts:

No posts found.
© 2025 CastAway Trader • Built with GeneratePress