Subscription: Access to Micro Counts of US indices
ES - should we change our count
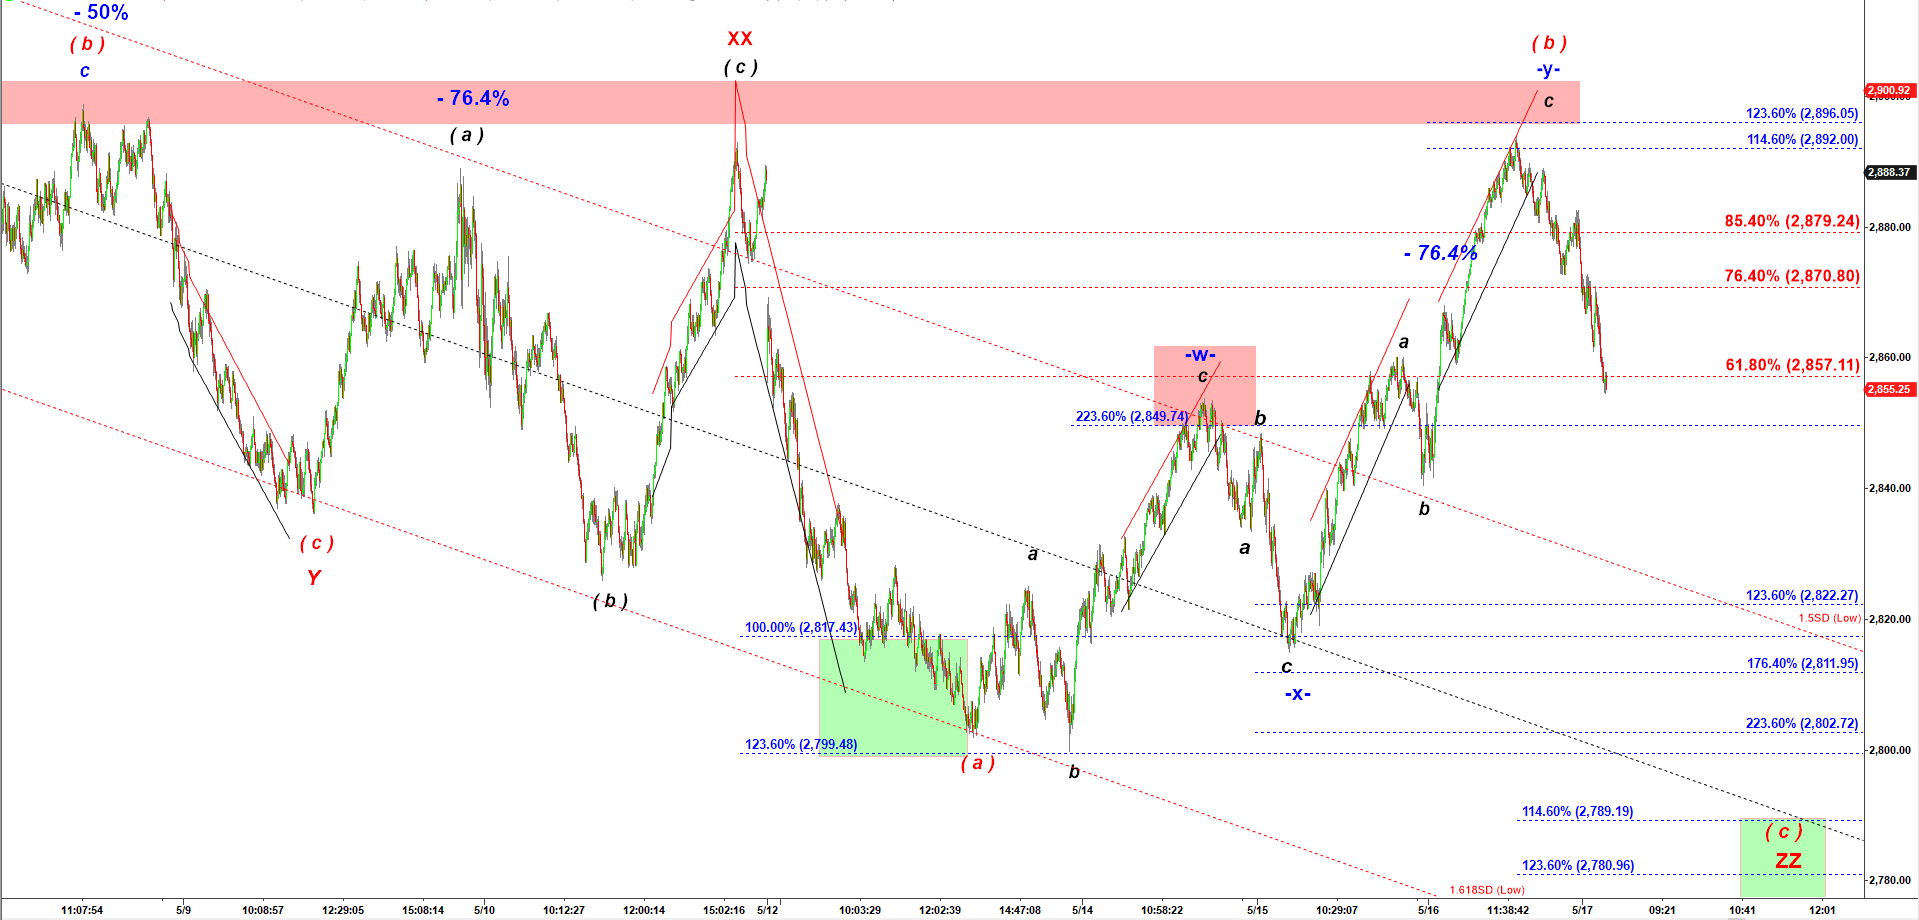
Yesterday I tracked that rally as a corrective wave ( b ) up. I expected them to push it to 2,896 but they stopped at 2,894. After close ES started to decline and it looked they could make that final push higher to my target but ES dropped lower.
At this point I do not see a reason to change my count. Wave ( b ) up looks complete and the count implies that ES has started its wave ( c ) down targeting a new lower low.
But the strength of the drop makes it suspicious. The final wave ( c ) down has to be structured as five waves down. Under that scenario the drop we see here is too strong to be wave i down. It looks like the heart of wave iii down but if it is the heart of wave iii down then it will not be able to extend for another 60 points lower to make a new lower low as required by the count….
At this point I do not have a good micro count to explain that drop and I stick to my primary scenario which implies the top we saw yesterday was a corrective wave ( b ) up.
ES - 4,500 tick bar chart at 8:40 AM on 5/17/2019