Skip to content
  • Home
  • US Market Updates
  • Indicators
    • Impulse Master
    • Cycle Trader
    • GANN Levels
    • Subscribe
  • Education
    • Beginners Video Course
    • Intermediate Video Course
      • Syllabus of the Course
    • Trading Like A Pro Video Course
    • Video Lesson of the Week
  • Chat Room
  • Pricing
  • FAQ
  • My Account
  • Login

Subscription: Access to Micro Counts of US indices

ES is hanging out in the target zone

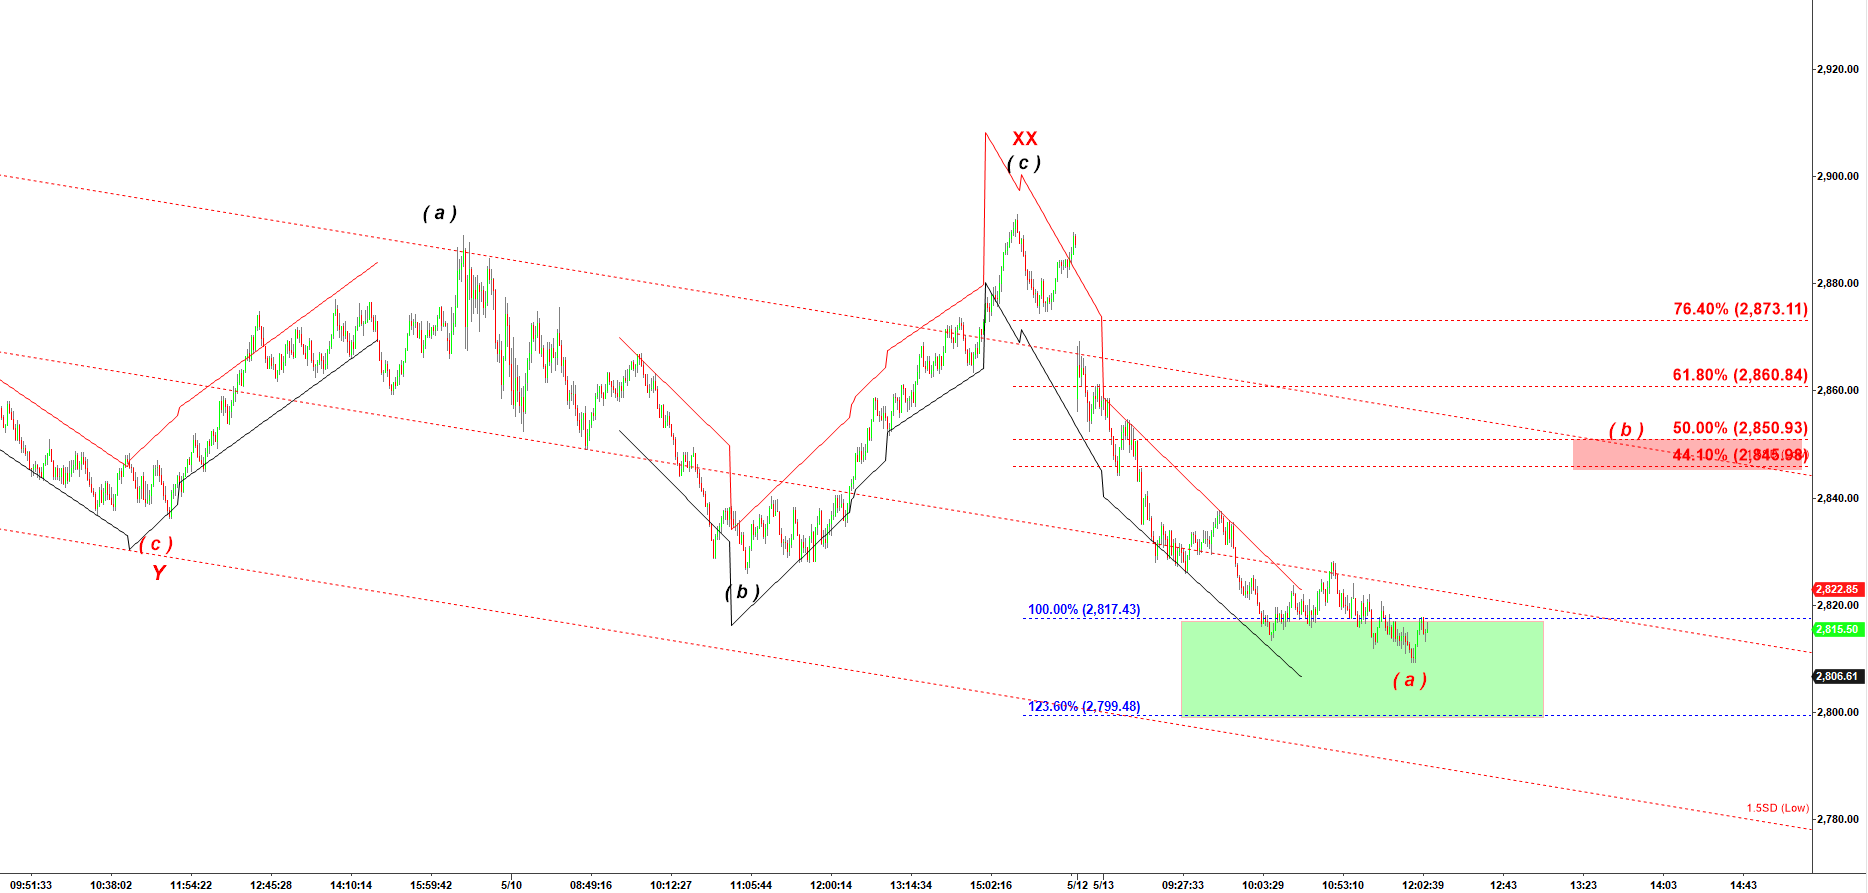
As expected ES dropped to 2,820-2,800 support zone. That is wave ( a ) down and we should get a corrective pullback in wave ( b ) up targeting 2,845 – 2,850 before the final decline in wave ( c ) down.
That wave ( a ) may stretch lower into the green box but did not have to.

ES - 4500 tick bar chart at 12:14 PM on 5/13/2019

Disclaimer

Previous posts:

No posts found.
© 2025 CastAway Trader • Built with GeneratePress