Subscription: Access to Micro Counts of US indices
ES - dropped as expected
On Friday I ES hit my target box and I explained, that the rally was corrective and most likely ES will drop again in another (a)-(b)-(c) down structure.
On Sunday evening I confirmed that prediction and wrote that the wave ( a ) down begun.
On Monday morning ES keeps moving lower following nicely the triple three structure corrective.
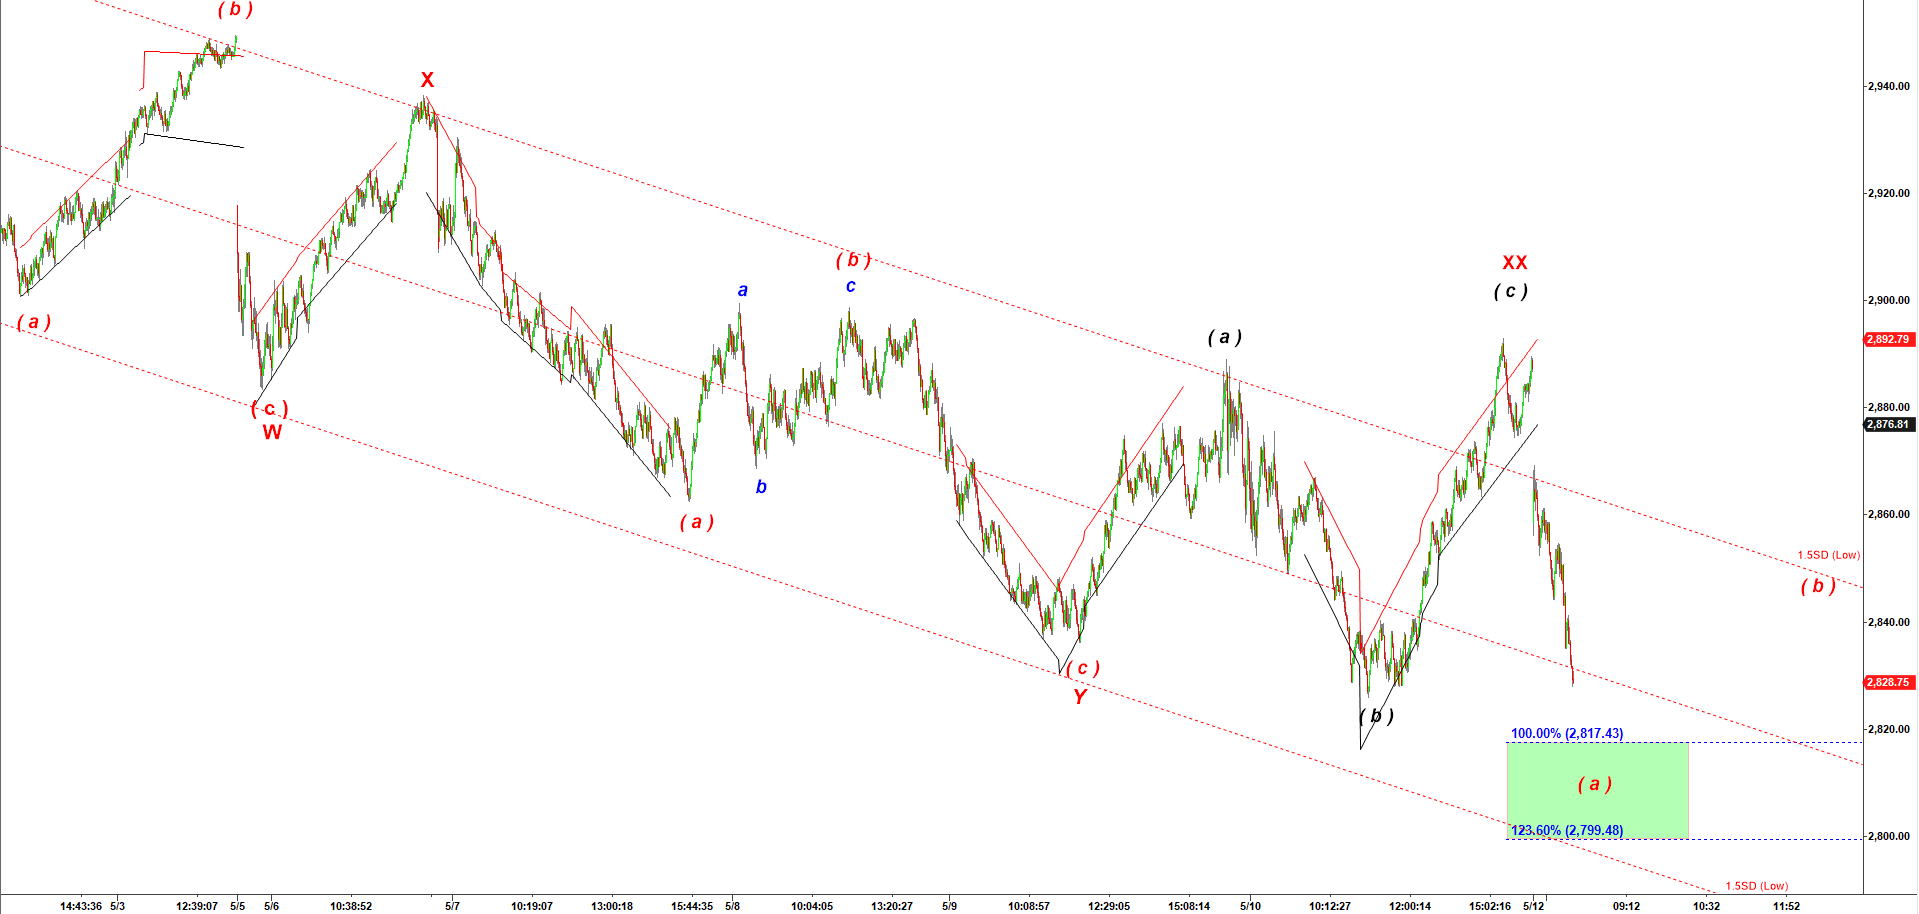
When wave XX topped it set a new starting point for another decline in (a)-(b)-(c) down structure.
That is why it is fairly difficult to predict where wave ( a ) can bottom.
We can use a bigger downward sloped channel and ES may stretch to the lower trendline.
Alternatively we can use the first decline in wave ( a ) down after the previous corrective wave X up
100% of that old ( a ) down = 2,817, 123.6% = 2,799.50.
But again, that final (a)-(b)-(c) down in the Triple Three structure is not supposed to be deep.
We may see a drop to 2,820 followed by a corrective move to 2,850 followed by the final drop to 2,790.
That should complete a larger corrective wave ( B ) down and set up a stage for a rally in wave ( C ) of ( 5 ) targeting new all time highs.
ES 4,500 ticks updated at 8:24 AM on 5/13/2019
Previous posts:
No posts found.