Skip to content
  • Home
  • US Market Updates
  • Indicators
    • Impulse Master
    • Cycle Trader
    • GANN Levels
    • Subscribe
  • Education
    • Beginners Video Course
    • Intermediate Video Course
      • Syllabus of the Course
    • Trading Like A Pro Video Course
    • Video Lesson of the Week
  • Chat Room
  • Pricing
  • FAQ
  • My Account
  • Login

GET REGULAR MICRO UPDATES FOR ONLY $24.99/month

That is a report posted for my subscribers at 3:15 PM on Friday. At that moment ES traded at 2,877.25. This morning it is traded at 2,830. I warned my subscribers that the rally was corrective and it was a good time to drop longs. And I shared my expectations for another decline.

ES entering resistance zone

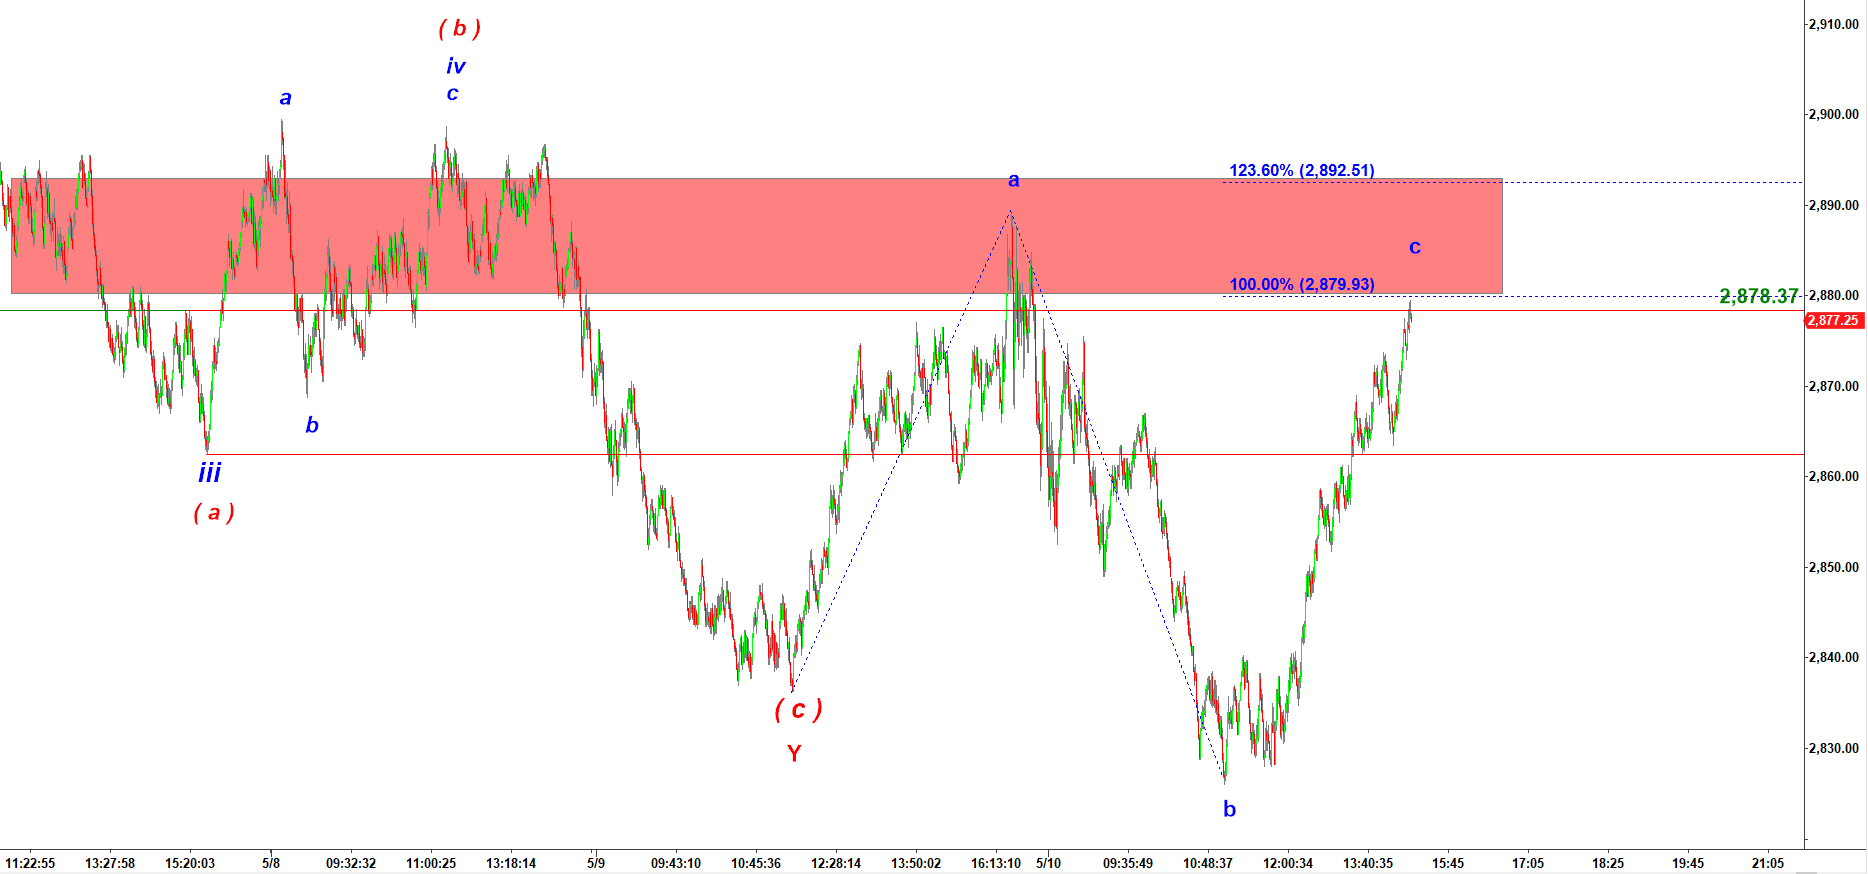
ES has played another a up (rally yesterday), followed by b down (drop in the morning) followed by wave c up (the current rally).
As you can see on the chart attached that a-b-c is entering a supply zone.

If you watched my video yesterday you may know I consider that a-b-c as a wave X up, a corrective rally before another decline. Therefore, I would be cutting longs in that red zone.

ES 3000 ticks updated at 3:10 PM on 5/10/2019

Disclaimer

© 2025 CastAway Trader • Built with GeneratePress