Skip to content
  • Home
  • US Market Updates
  • Indicators
    • Impulse Master
    • Cycle Trader
    • GANN Levels
    • Subscribe
  • Education
    • Beginners Video Course
    • Intermediate Video Course
      • Syllabus of the Course
    • Trading Like A Pro Video Course
    • Video Lesson of the Week
  • Chat Room
  • Pricing
  • FAQ
  • My Account
  • Login

Subscription: Access to Micro Counts of US indices

ES - two bearish scenarios point to extension lower to 2,800

From my yesterday post you know that were several alternative bearish scenario. Let me update you on that: 
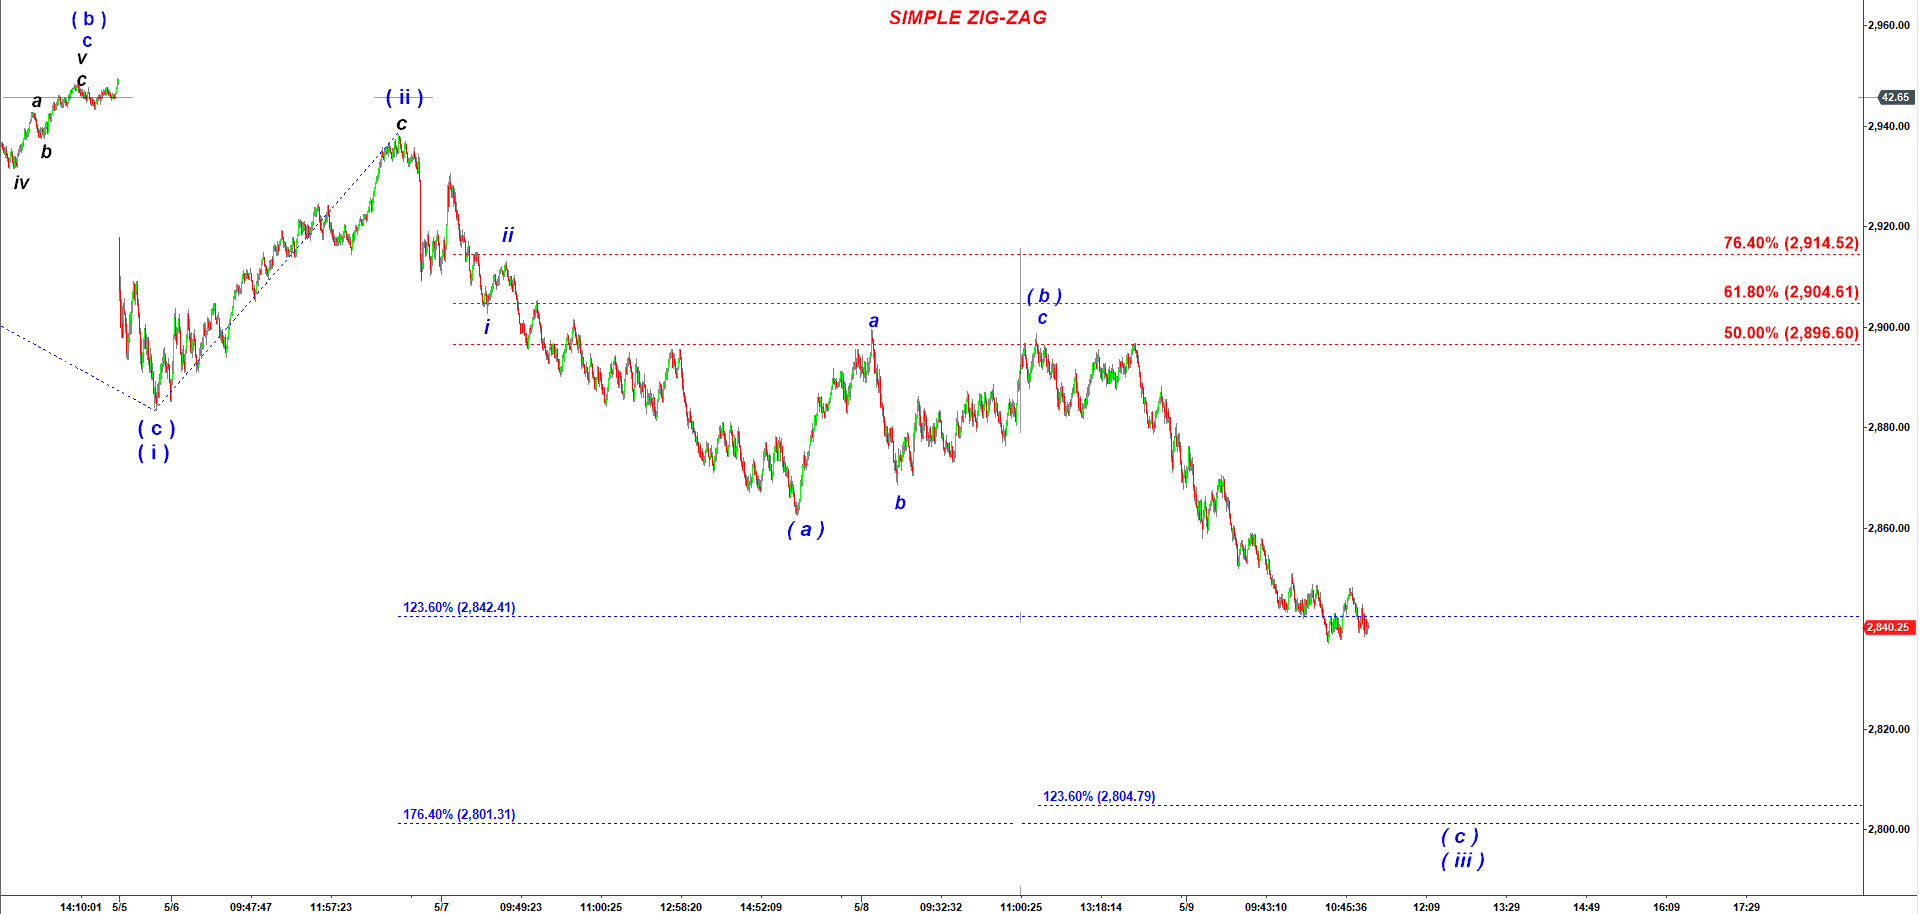
Simple Zig-Zag ( the most bearish ). Under that scenario we are in the strongest part of the decline, wave ( c ) of ( iii ) down. And the minimum target is 2,800. The rule is wave ( c ) of ( iii ) should be at least 123.6% of wave ( a ) of ( iiii ) and wave ( iii ) should be at least 176.4% of wave ( i ) down. That gives us a confluence 2804-2801.

ES 3000 ticks count under the "Bearish" Simple Zig-Zag count - updated at 11:20 AM on 5/9/2019

There is another much less bearish count where ES has been following a Double Three W-X-Y structure. W-X-Y is a corrective pattern connected of a pair pf A-B-C’s.

ES 3000 ticks count under the "Less Bearish" W-X-Y count - updated at 11:20 AM on 5/9/2019

Previous posts:

No posts found.
© 2025 CastAway Trader • Built with GeneratePress