Subscription: Access to Micro Counts of US indices
ES - a bigger picture is bearish
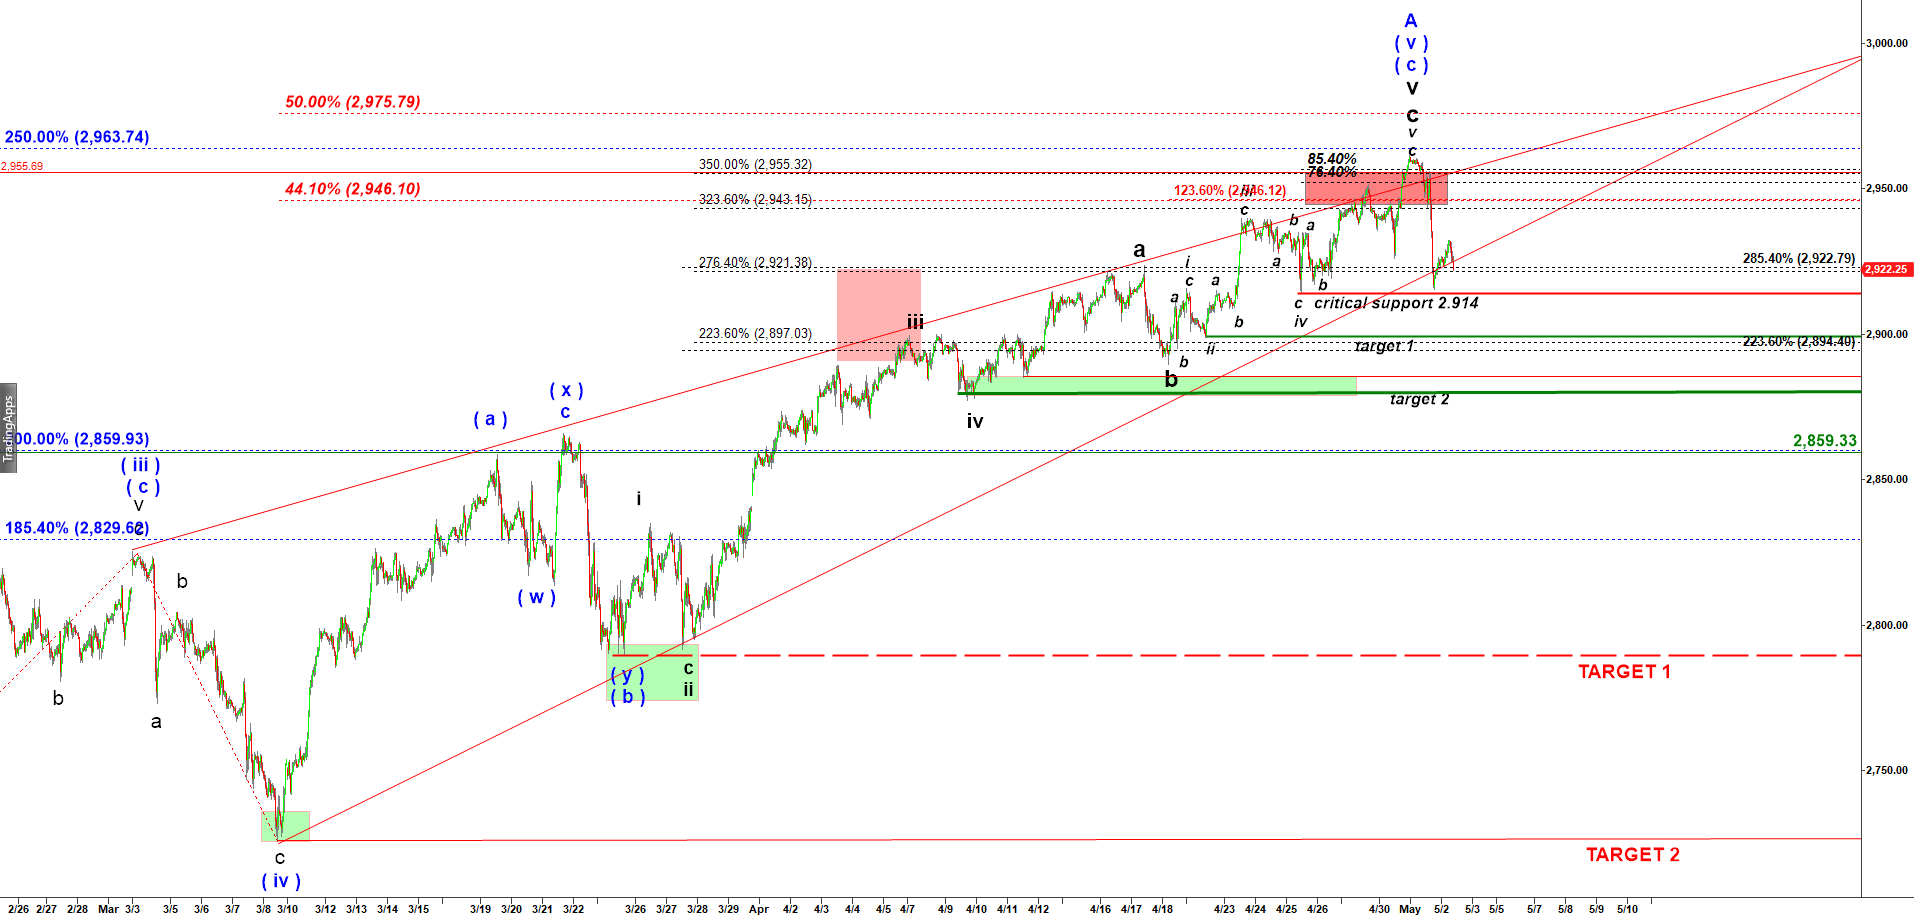
This wave A up started off the December 2018 low looks complete. Moreover, it looks like a bearish wedge, a strong invitation for bears to join the party. That wave B down may be shaped as a down – b up – c down. And the first leg down in subwave a does not need to be huge. It can extend to 2,894 and complete. Then we may get a dull and deep wave b up that should calm down bears and give hope to bulls that it was a quick correction to be followed by a new rally. And only after a corrective b up which, by the way, could even make a slightly new higher high, we may get a really strong decline in subwave c of B down. That subwave c may be much longer that subwave a stretching to 223.6% or even 276.4% of the first leg down in subwave a.The plan here is to close shorts once ES approaches to 2,894 and then wait fro a corrective subwave b up to re-short.
ES Mini - 45 min chart updated at 8:45 AM on 5/2/2019