Subscription: Access to Micro Counts of US indices
ES - fully completed rally on several timeframes
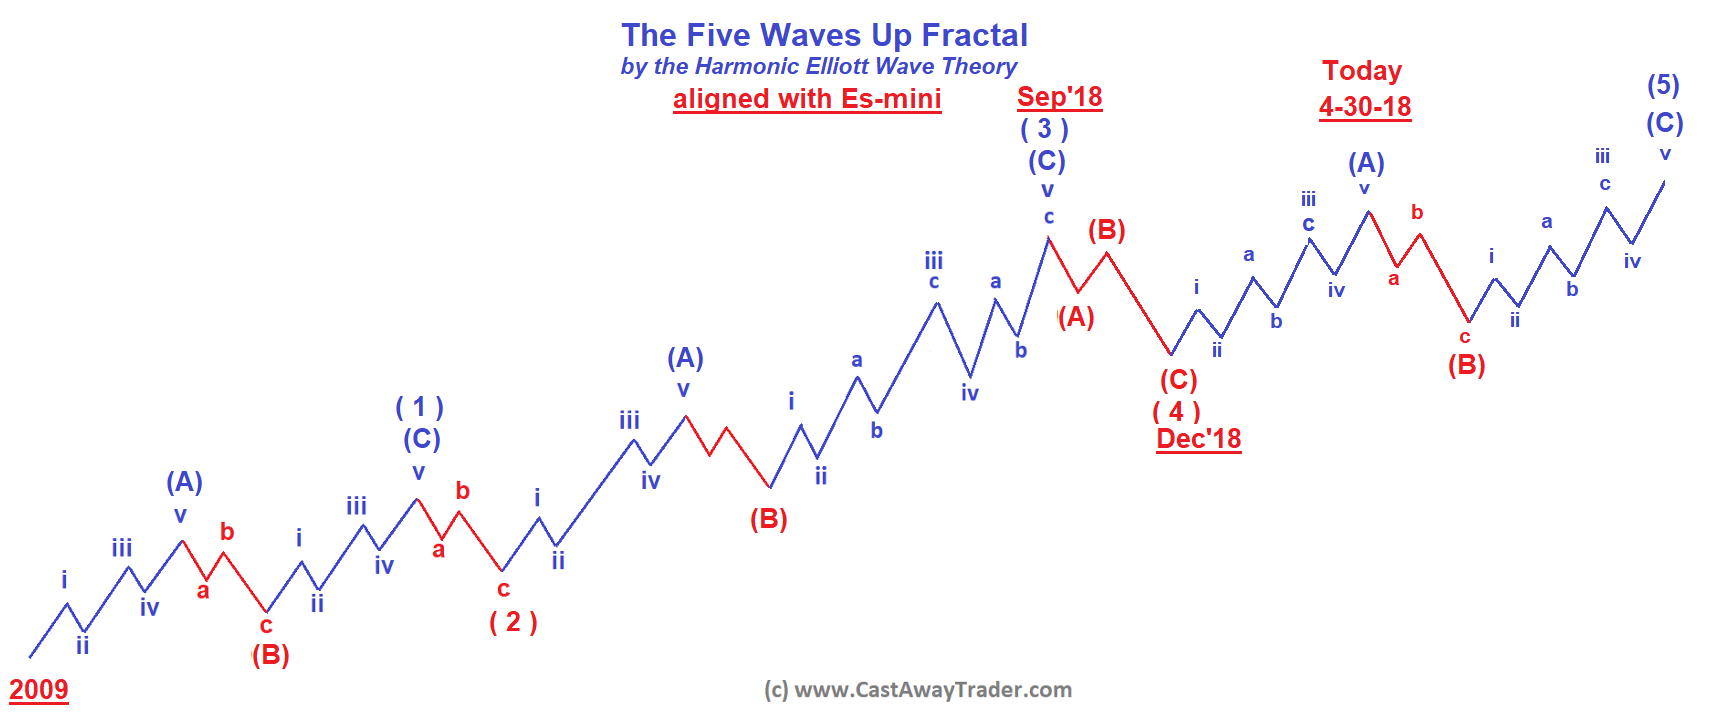
ES has enough waves to consider the whole Five Wave up fractals started off December 2018 low completed. We needed to get full five waves up ideally retesting the previous top reached in September 2018 by preceding impulsive wave ( 3 ) up. We have got both conditions.
The Model Five Wave up fractal proposed by the Harmonic Elliott Wave theory
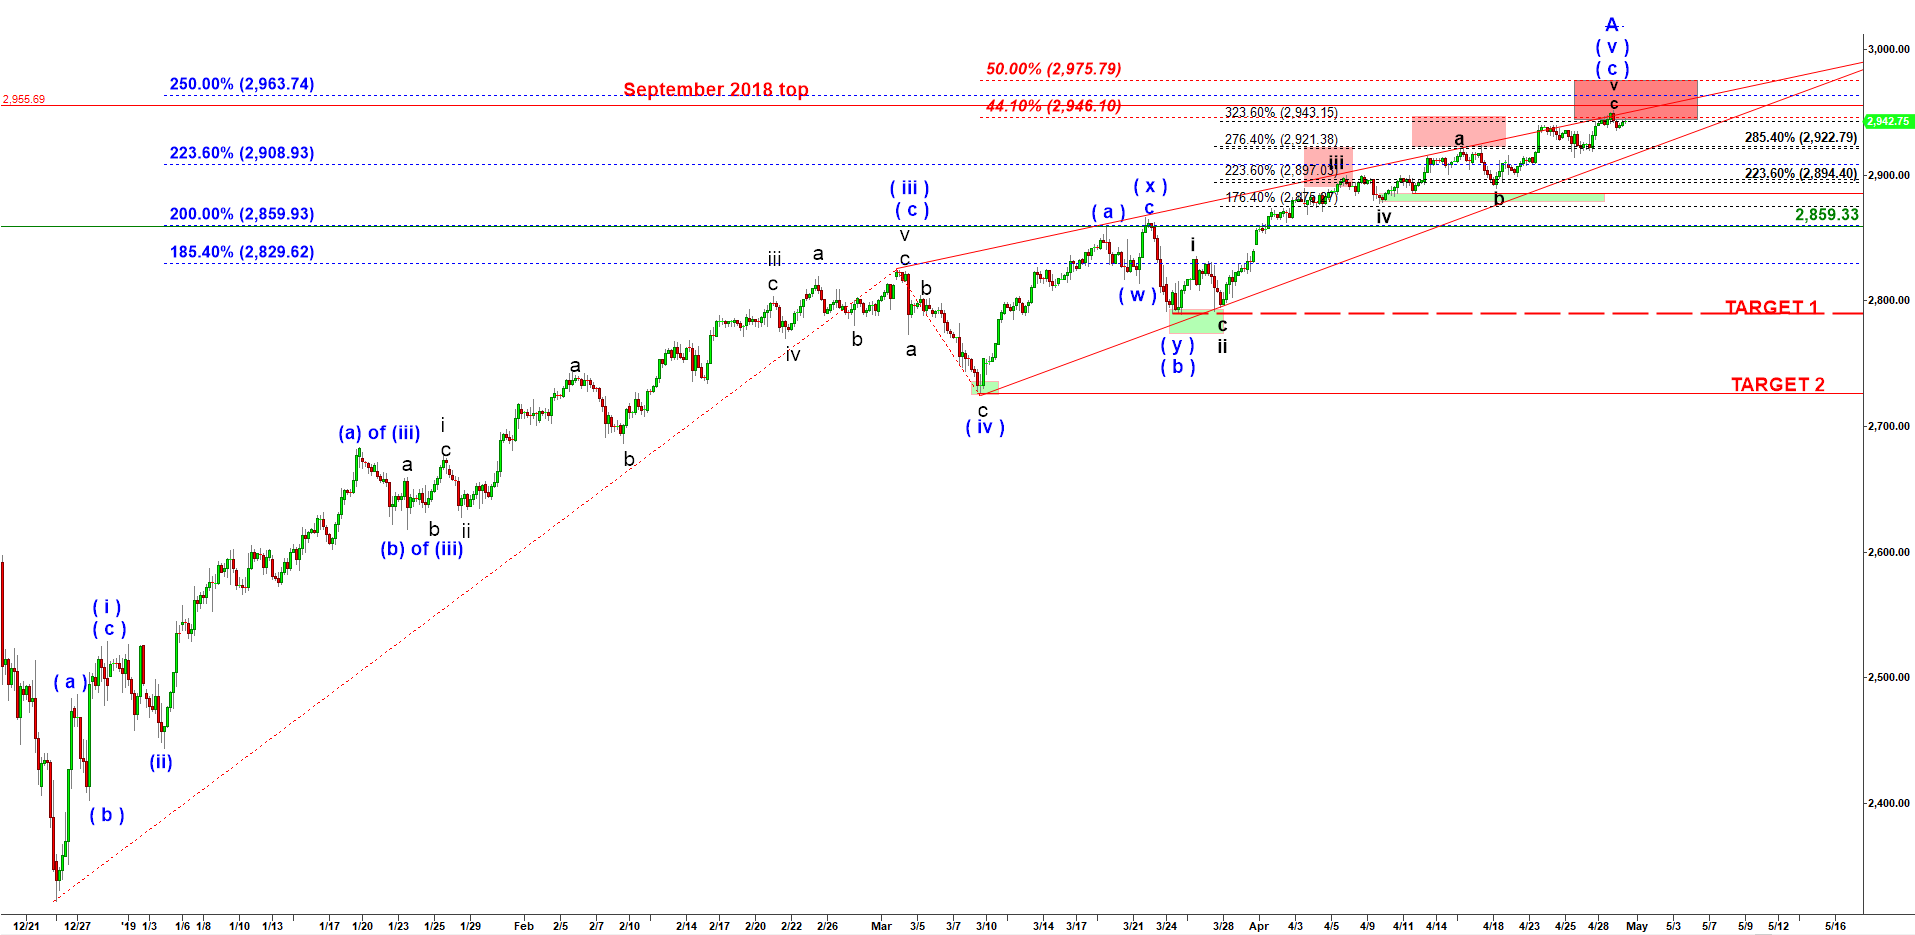
On the 4 hour chart below you can see that ES is retesting the previous top made in September 2018. And it has completed five waves off the December 2018 low. You can see that its final wave ( v ) has drawn a pattern recognized by conventional technical analysts as a bearish wedge.The lower trend line and the upper trend line forming the wedge both look up. But the slope of ascent of the lower line is steeper. That is a sign that bears have repeatedly defended attempts of bulls to breakout through the upper trend line.
I expect ES to breakdown under the lower trendline and at least reach the Target 1.
ES mini - 4 hour chart updated on 30 April 2019
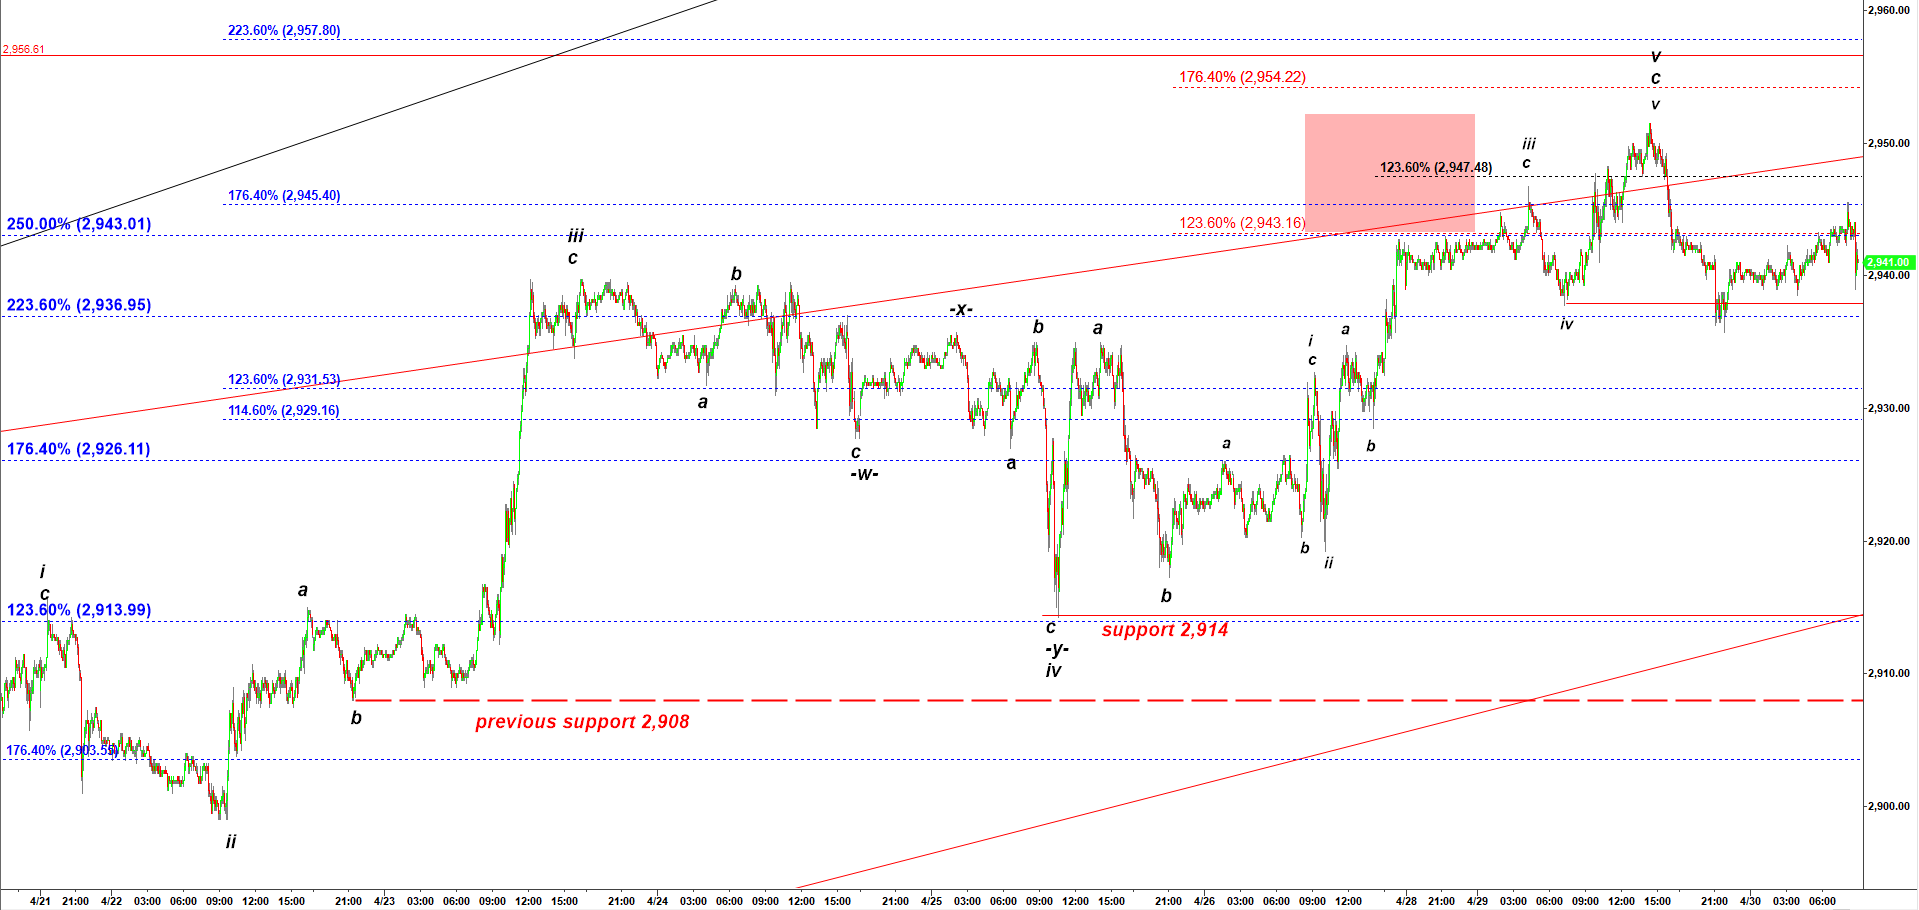
Even if I zoom-in to 5 min chart in order to nail completion of the very last squiggle up in the final wave c of v I can count perfect completion of that micro structure. As you can see on the chart below, last night it violated a signal support at the low made by the previous corrective wave iv down. That is a bearish sign that confirms completion of that micro rally.
ES mini - 5 min chart updated at 8-50 AM on 30 April 2019