Case Studies:
The best way to understand how this pattern works is to study collection of charts with real life examples.
- Subscribe Now and Start Learning
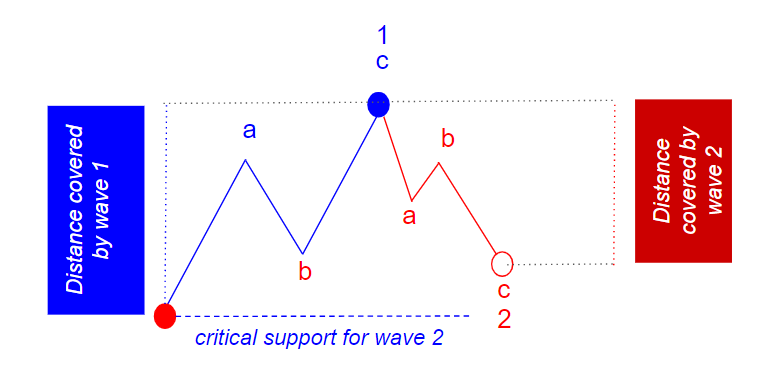
Corrective Wave 2 is always shorter than impulsive wave 1. Wave 2 reacts to a preceding impulsive wave 1. We always measure counter trend wave 2 in terms of ratio of its length to length covered by preceding wave 1. We call such a ratio “retracement ratio”.
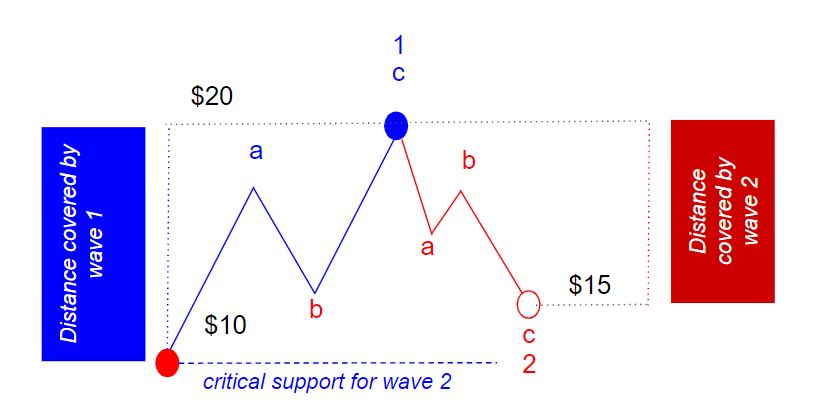
Let’s review a simple example:
Wave 1 starts at $10 and completes at $20. Its length is $20 – $10 = $10.
Wave 2 starts at the top of wave 1 at $20 and drops to $15. Its length is $20 – $15 = $5.
Then retracement ratio of that wave 2 will be $5 / $10 = 0.5 or 50%
The best way to understand how this pattern works is to study collection of charts with real life examples.