Skip to content
  • Home
  • US Market Updates
  • Indicators
    • Impulse Master
    • Cycle Trader
    • GANN Levels
    • Subscribe
  • Education
    • Beginners Video Course
    • Intermediate Video Course
      • Syllabus of the Course
    • Trading Like A Pro Video Course
    • Video Lesson of the Week
  • Chat Room
  • Pricing
  • FAQ
  • My Account
  • Login

Subscription: Access to Micro Counts of US indices

RUT - should finally reach it's long term target over 1,600

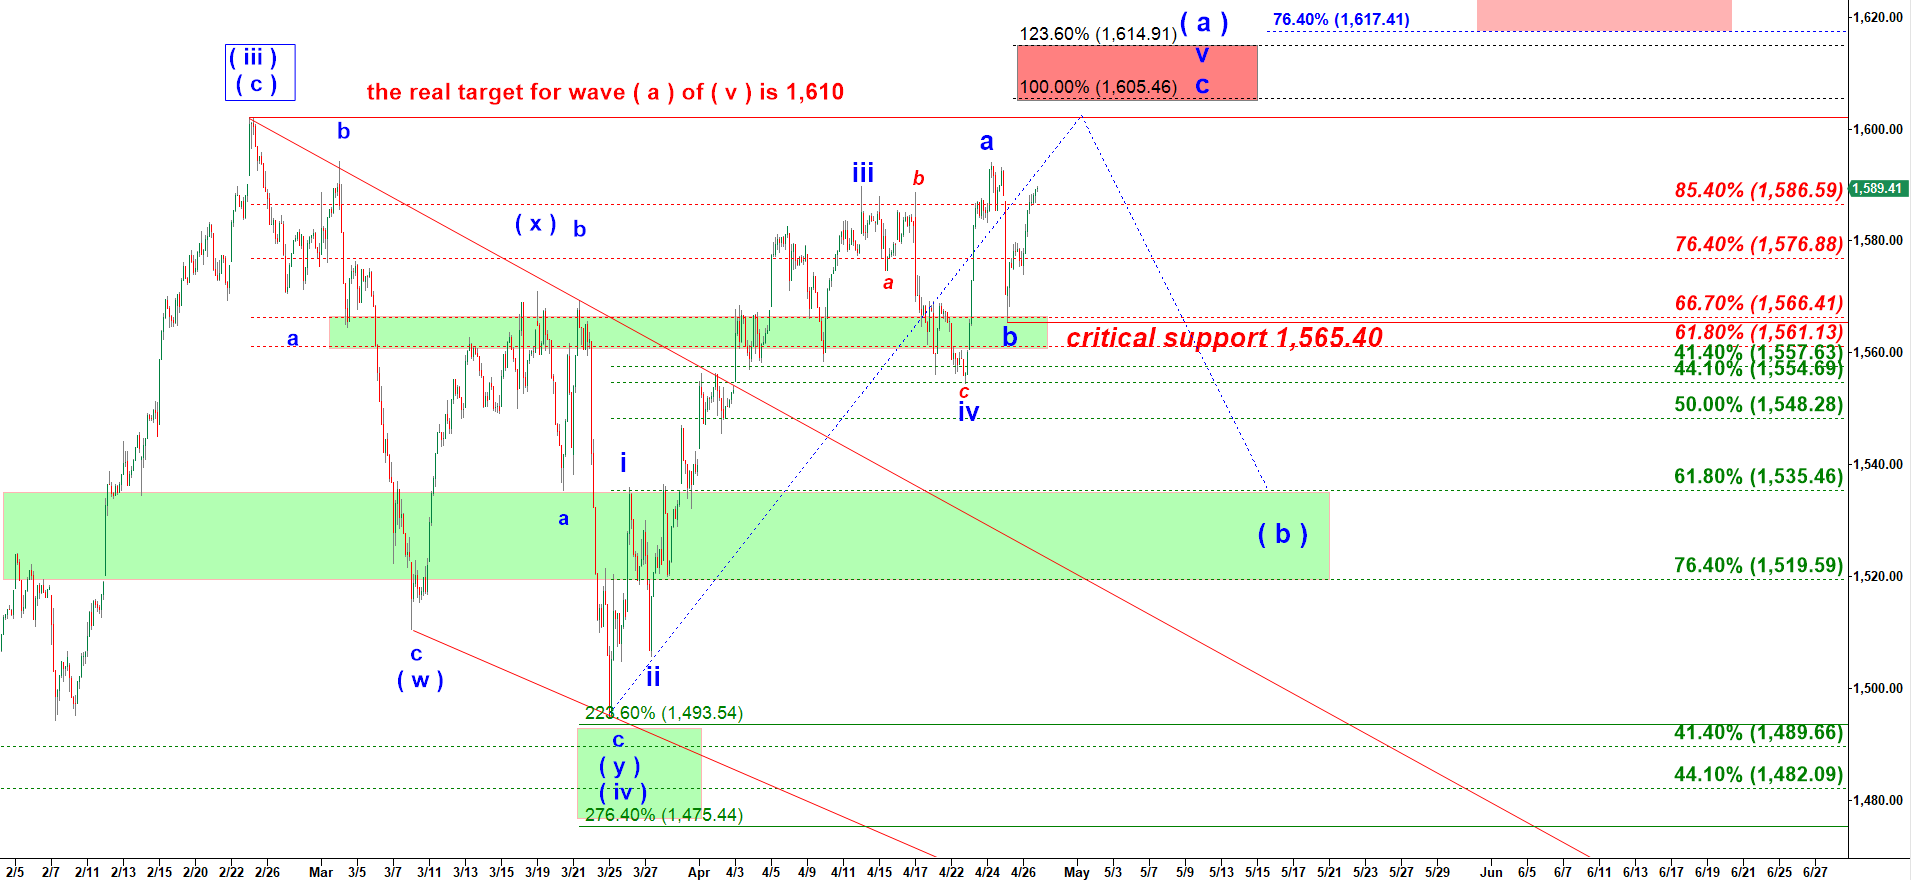
For weeks I have had that “real target” of 1,610 on my RUT charts. And here we have an ideal structure to tag that target and to complete the rally off December 2018 low. Then we should finally get  corrective wave ( b ) down.

RUT - 45 min chart updated at 3:00 PM on 4/26/2019

Previous posts:

No posts found.
© 2025 CastAway Trader • Built with GeneratePress