Subscription: Micro Counts of Crude Oil & Nat Gas
Crude Oil - has it topped?
I have been counting the rally off December 2018 low as a corrective A-B-C up in wave ( B ) up of ( 5 ) down.
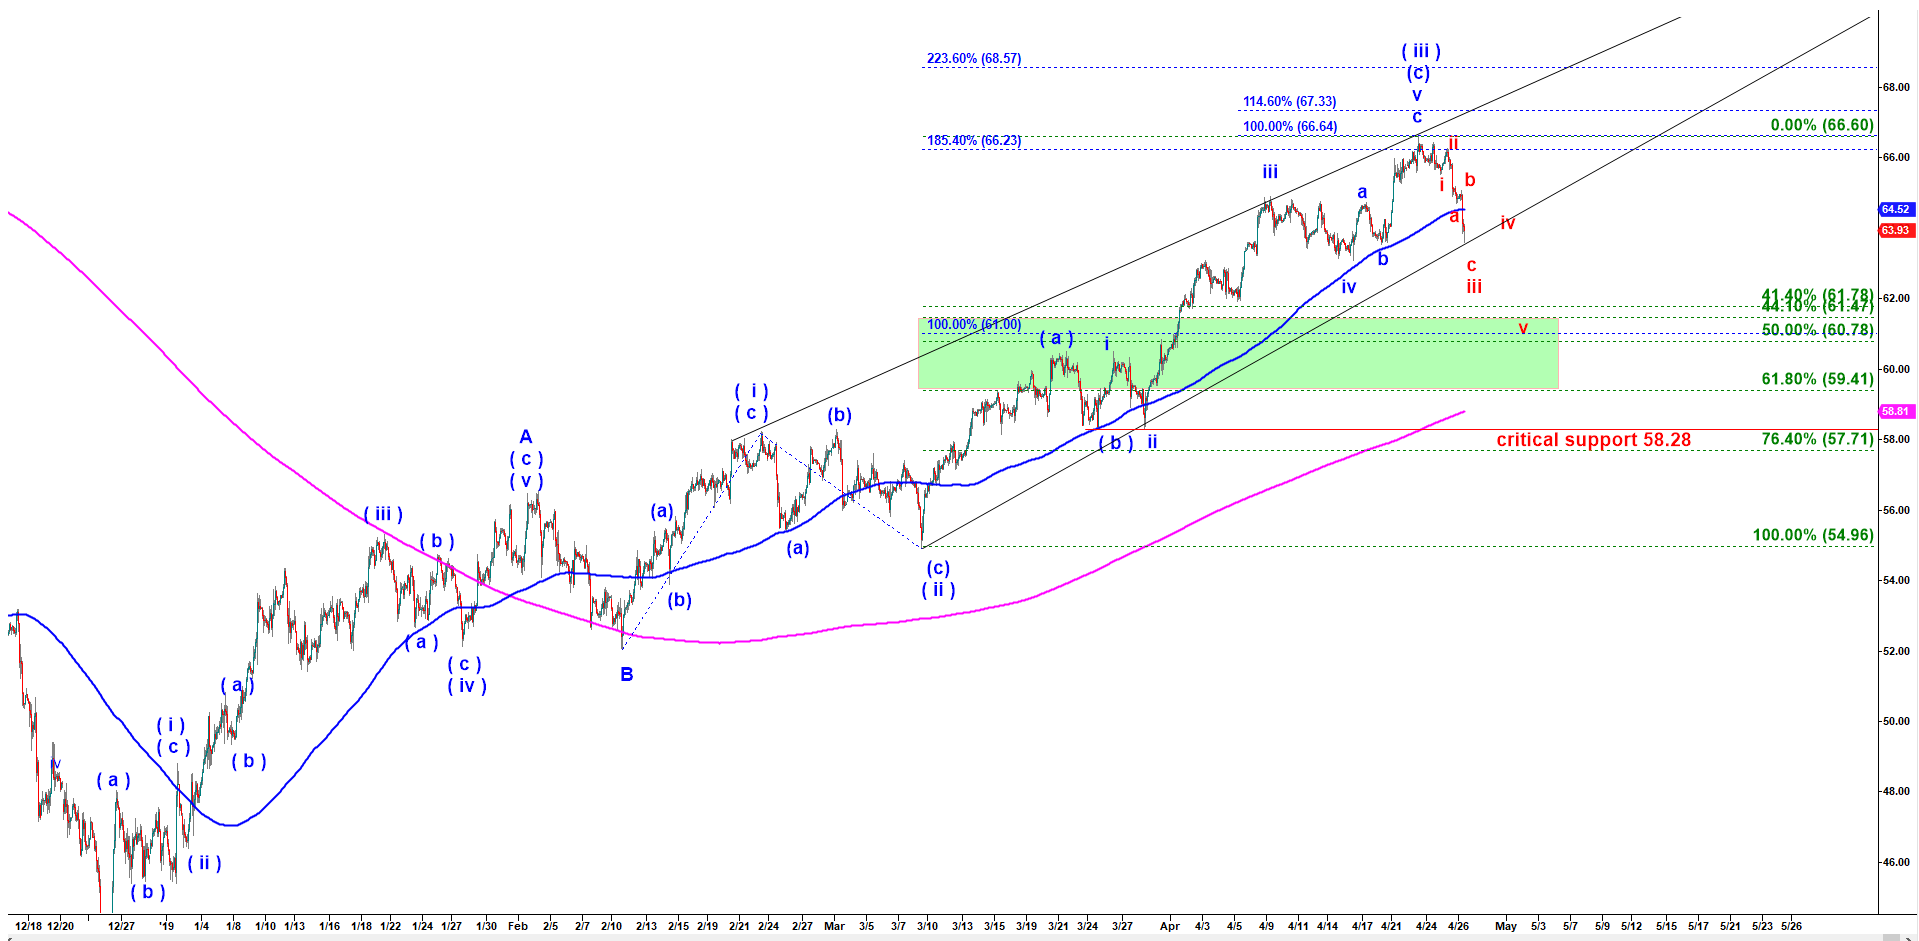
Wave A up topped at 56.55 on 4 Feb 2019. Wave B down bottomed at 52.03 on 11 Feb 2019. Since that bottom Crude has been rallying in wave C up. Wave C up has to be subdivided into five waves of a smaller degree (i), (ii), ( iii ), ( iv ) and ( v ). Have we got all five waves off teh February low? On the chart below you can see that there is an option where we have not. We might have only completed ( iii ) of C. And this sharp drop is a typical ( iv ) of C of 3. Where this drop may get completed? I would say in the area 61.80 – 60.50. First, this is where we have typical retracement ratios fro the wave ( iii ) up. Second, wave ( iv ) should find a strong support under the top of wave ( a ) of ( iii ) (60.50). And, finally, I have 200 MA on 45 min chart at 61.85. If that count is right then we are dealing with only a pullback in wave ( iv ) down setting s stage for another rally in wave ( v ) up targeting one more higher high.
Crude Oil - 90 min chart updated at 8:50 AM on 4/26/2019