Skip to content
  • Home
  • US Market Updates
  • Indicators
    • Impulse Master
    • Cycle Trader
    • GANN Levels
    • Subscribe
  • Education
    • Beginners Video Course
    • Intermediate Video Course
      • Syllabus of the Course
    • Trading Like A Pro Video Course
    • Video Lesson of the Week
  • Chat Room
  • Pricing
  • FAQ
  • My Account
  • Login

Subscription: Micro Counts of Crude Oil & Nat Gas

Crude Oil - first sign of topping

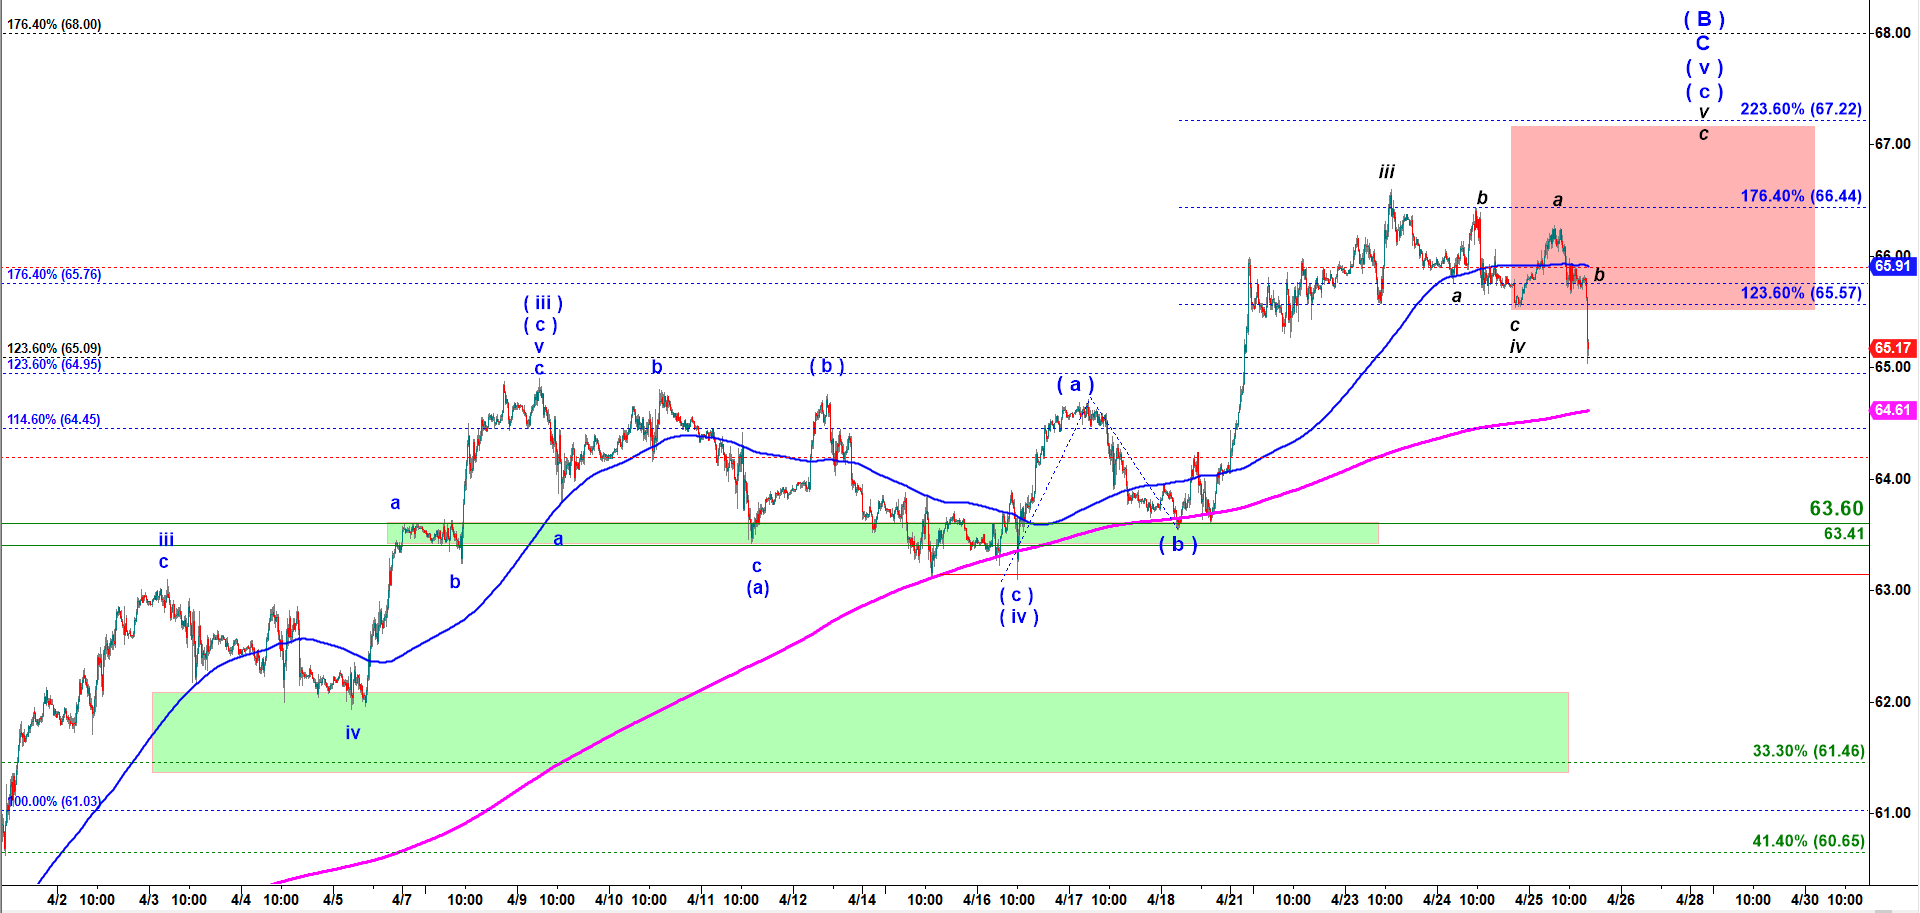
Instead of making another high crude has just strongly dropped under the previous low. It still can go higher and we can count that drop as part of correction before another push up. But that is a strong sign of weakness. On such a micro level it was not supposed to act like that if it was strong enough to keep moving higher. If you look at a bigger picture, Crude has played out enough waves to consider A-B-C waves off December 2018 low. It has arrived into the Red Target Box. And now it has dropped out of it. It’s a strong bearish sign!

Crude Oil - 45 min chart updated at 2:15 PM on 4/25/2019

Previous Updates:

No posts found.
© 2025 CastAway Trader • Built with GeneratePress