Subscription: Micro Counts of Crude Oil & Nat Gas
NG - I still expect lower lows
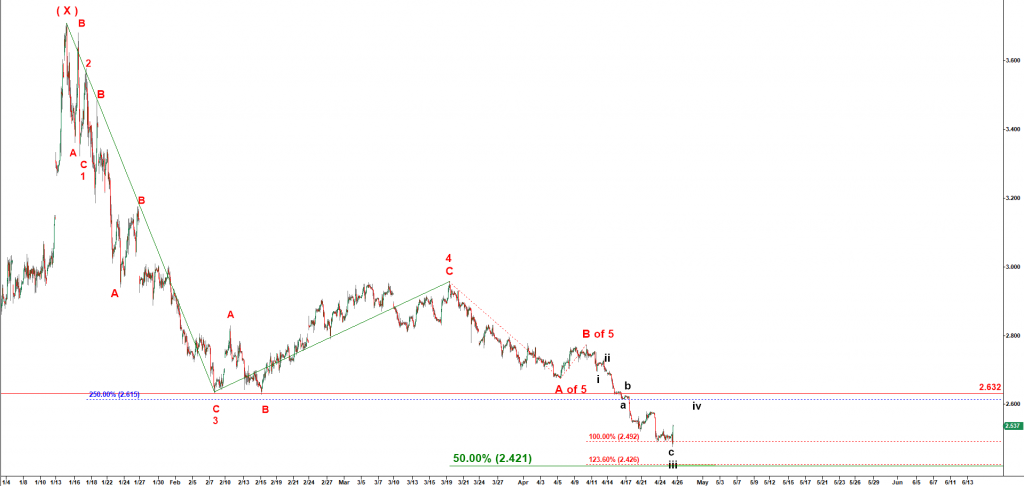
This time I try to reconstruct W-X-Y down structure that I first noticed in Tradingview. The problem is two data feeds I work with, the one provided by Tradestation and another one provided by Tradingview differ from each other.
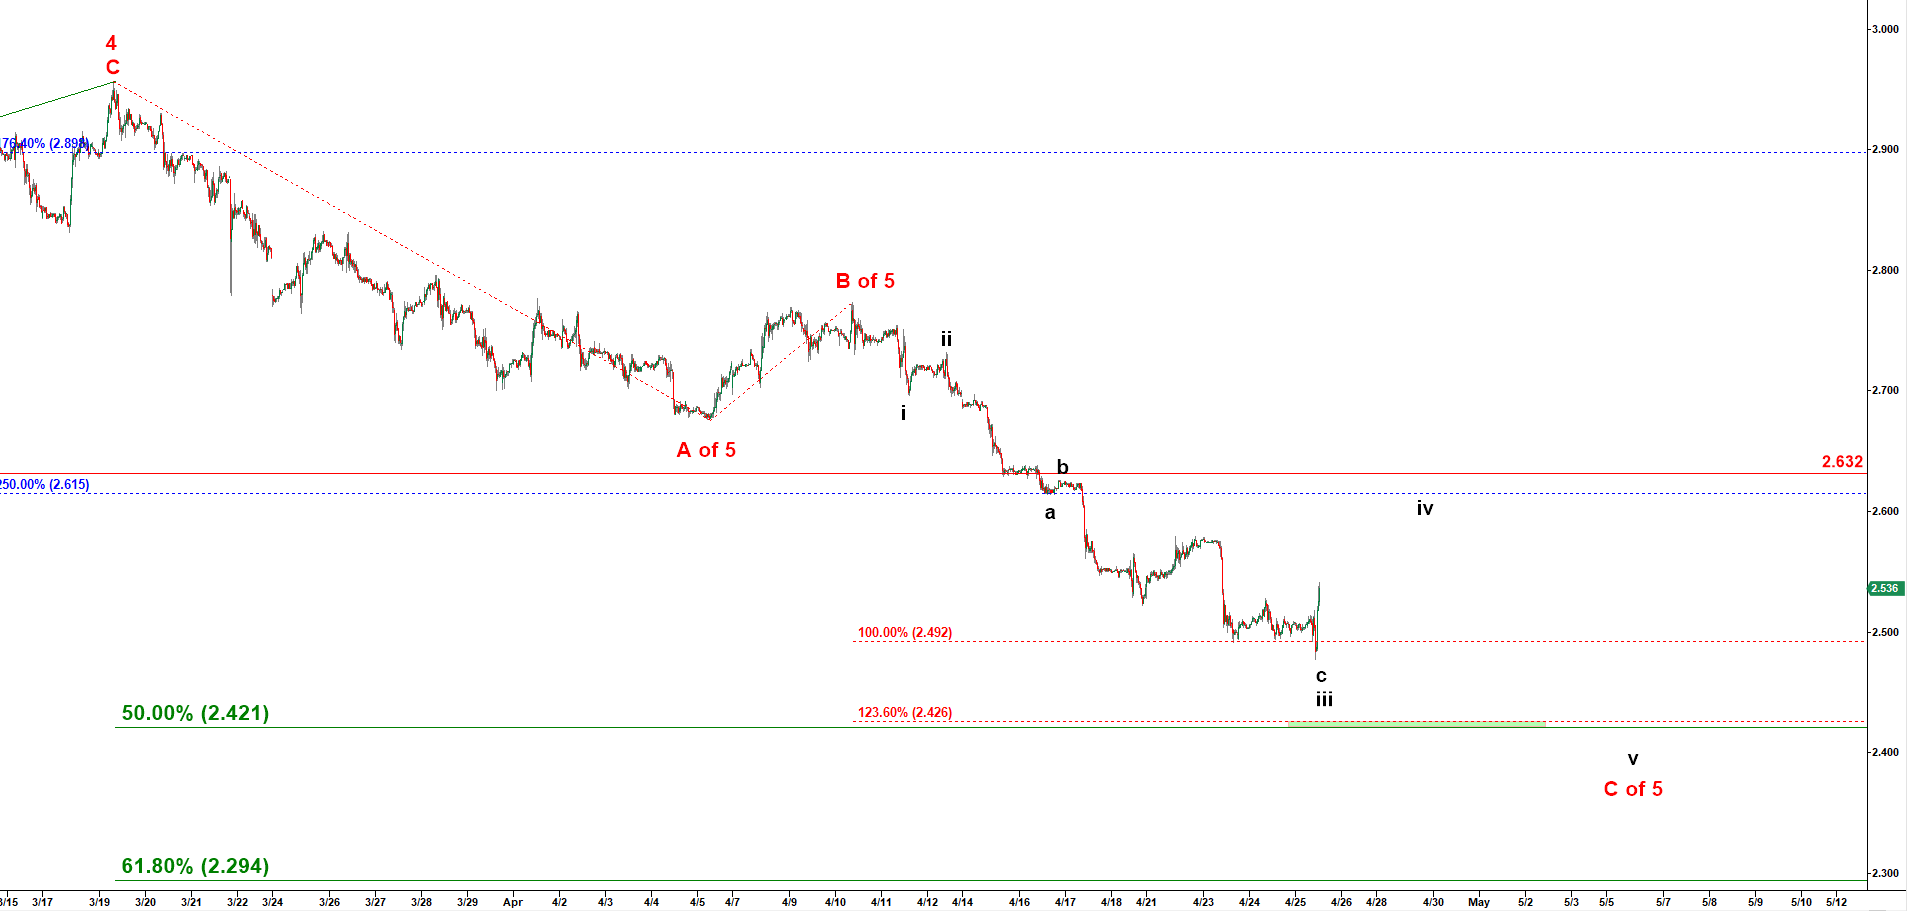
I count the top made at 3.706 in January 2019 as a top of wave ( X ) up. Off that top we should get two legs down in A-B-C down corrective pattern. We are dealing with the first leg down in a large wave ( A ) of ( Y ). That wave A down has to be subdivided into five smaller waves. At this point NatGas is working on the very final wave C of 5. Let’s zoom in to 30 min chart below to check where the black wave v of the red C of 5 can bottom.
Natural Gas - 90 min chart updated at 12-00 PM on 25 April 2019
The spike we are getting today looks like a micro pullback in wave iv up (black micro count). I still expect another push lower in wave v of C of 5 of ( A ). Once we bottom in that final wave C of 5 (the red count) we should expect a large pullback up in wave ( B ) up targeting at least 2.75 and even 2.900.
Natural Gas - 30 min chart updated at 12:00 PM on 25 April 2019