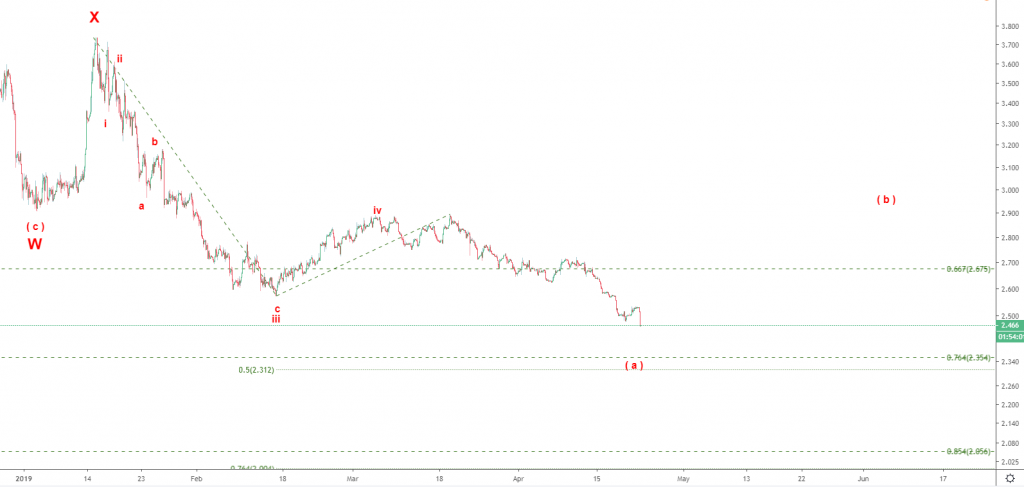
In the Macro analysis posted on 23 April 2019 the most bullish scenario I could come up with was the one shown below. It implies that we are going to get a pullback in wave ( b ) up as soon as this decline in wave ( a ) down gets completed. Let’s zoom-in to 1 hour chart to see where it can bottom.
Natural Gas - 2 hour chart updated on 23 April 2019
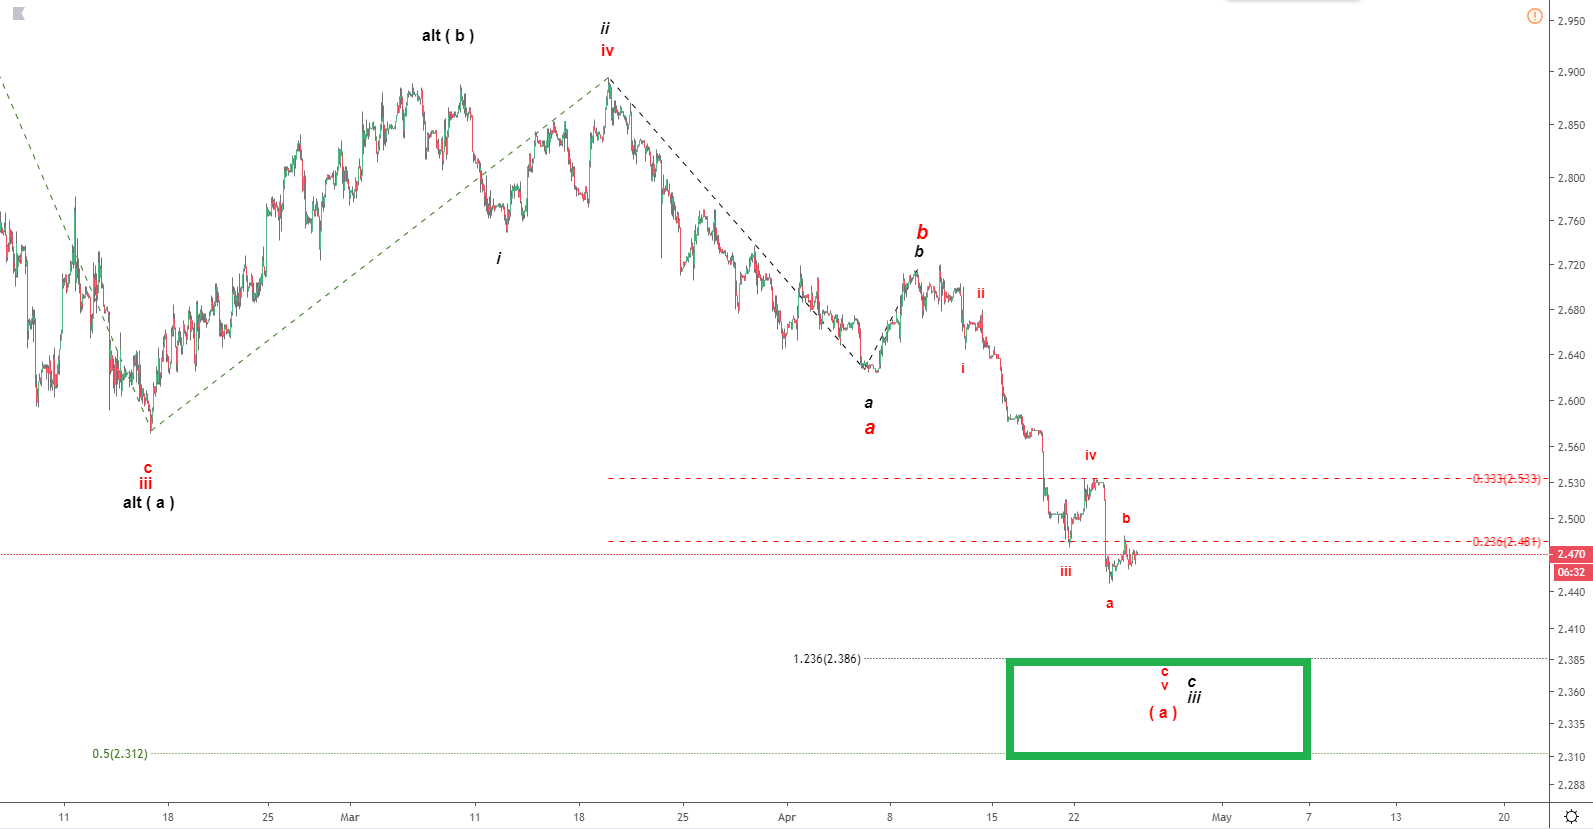
The micro count below implies that we need one more drop into the green target box to complete wave ( a ) down started off the top at 3.74 reached in January 2019. Under that count we may get a corrective wave ( b ) up that could move price back up at least to 2.89. And that means a rally of over 20% from the green target box! Unfortunately that is not the most reliable setup. We still have a more bearish scenario where NatGas is inside the strongest part of the decline, wave c of iii ( black labels). Please be cautious and trade small.
Natural Gas - 1 hour chart updated at 11:53 PM on 24 April 2019