Subscription: Access to Micro Counts of US indices
RTY stretched higher as expected
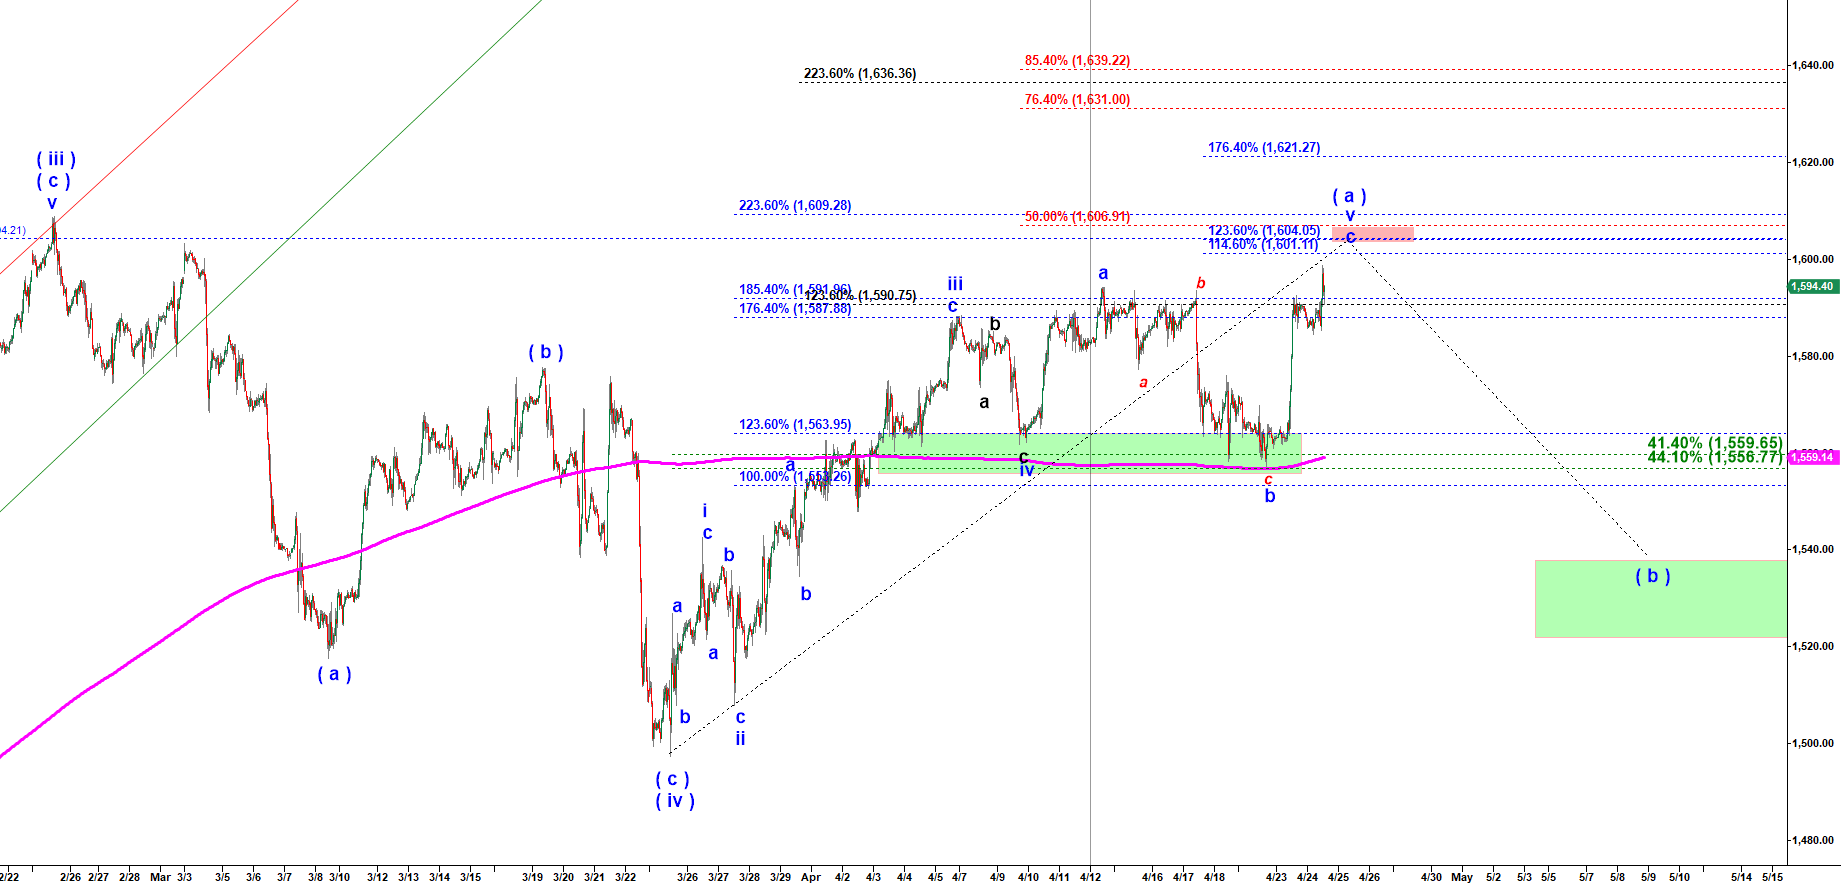
In the previous report I wrote: “That is wave c of v of ( a ) of ( v ). It still can move a bit higher to exceed the previous top made by wave a of v ( 1,594.20 reached on 12 Apr 2019 ).”
RTY has done that and now it has enough waves to consider that wave ( a ) of ( v ) having topped. At this point I should repeat what I wrote this morning:
“At this point I would wait for a corrective a-b-c down in wave ( b ) down of ( v ) up. It is barely possible to predict how deep that ( b ) down may get. We will be watching a corrective (a)-(b)-(c) down structure tagging one of the common retracement levels: 50% – 1,550, 61.8% – 1,537 or 76.4% – 1,522. Those retracement ratios have to be applied to a rally started off the 1,497.40 low made on 25 March 2019.”
RTY - 14 min chart updated at 12:20 PM on 4/24/2019