Skip to content
  • Home
  • US Market Updates
  • Indicators
    • Impulse Master
    • Cycle Trader
    • GANN Levels
    • Subscribe
  • Education
    • Beginners Video Course
    • Intermediate Video Course
      • Syllabus of the Course
    • Trading Like A Pro Video Course
    • Video Lesson of the Week
  • Chat Room
  • Pricing
  • FAQ
  • My Account
  • Login

Subscription: Micro Counts of Crude Oil & Nat Gas

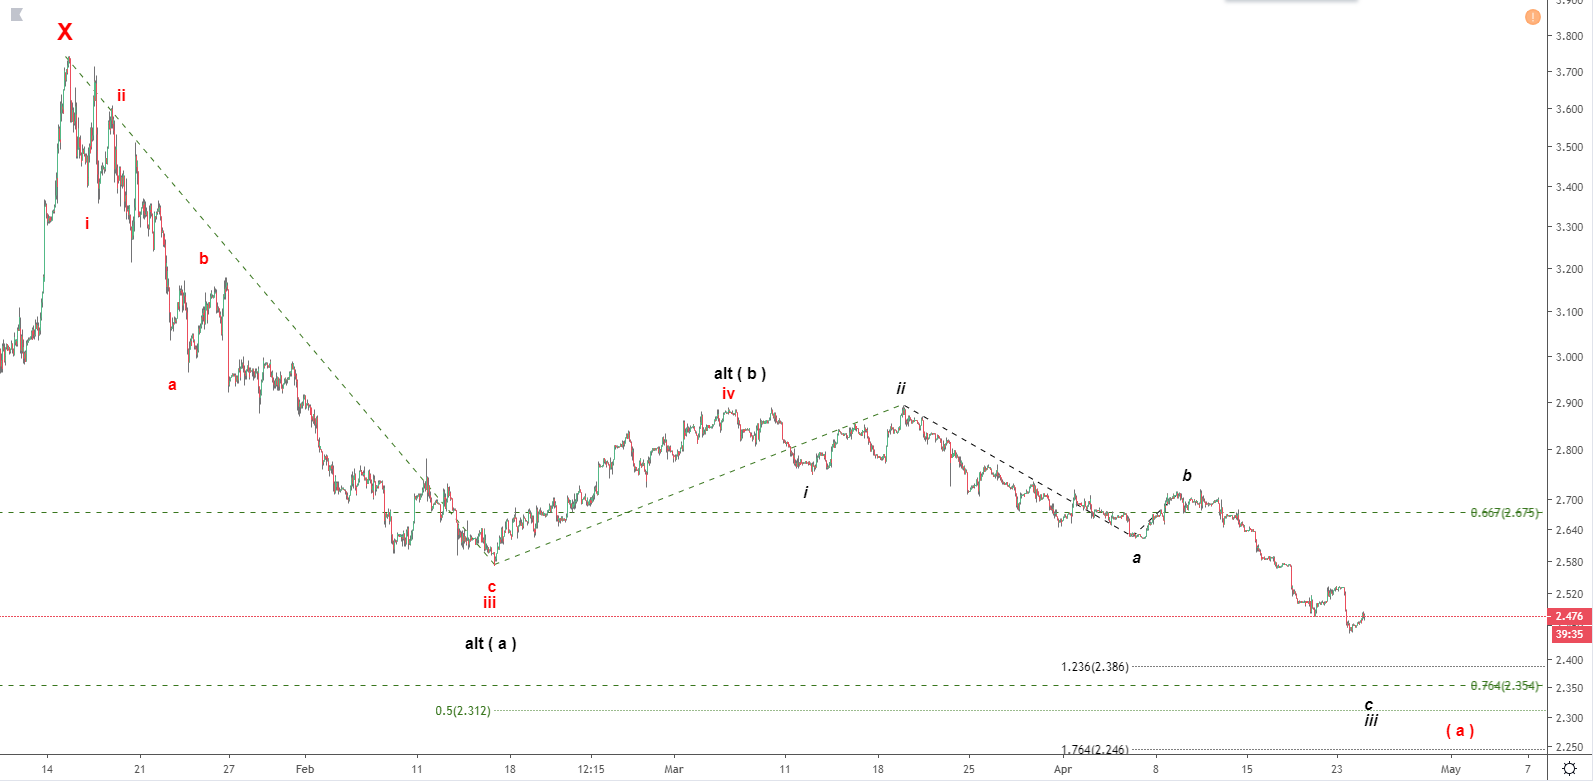
Natural Gas -no bottom in sight

In the previous update posted yesterday I noted that NG may be declining in a corrective W-X-Y structure off the November 2018 top.
Again we have two options here:
the first is that we are still working on five down in wave ( a ) of Y (red labels)
The second is wave (a) down and (b) up are upon us and we have started ( c ) down (black labels).
in both cases it should keep moving down. I do not see a potential completion for none of those two scenarios. No setup here. Keep watching.

Natural Gas - 45 min chart updated at 9:30 AM on 4/24/2019

Previous Updates:

No posts found.
© 2025 CastAway Trader • Built with GeneratePress