Subscription: Access to Micro Counts of US indices
RTY rallied as expected. What is the next trade?
In the previous update I predicted a rally and wrote: “it looks like it is ready to rally to another higher high.”
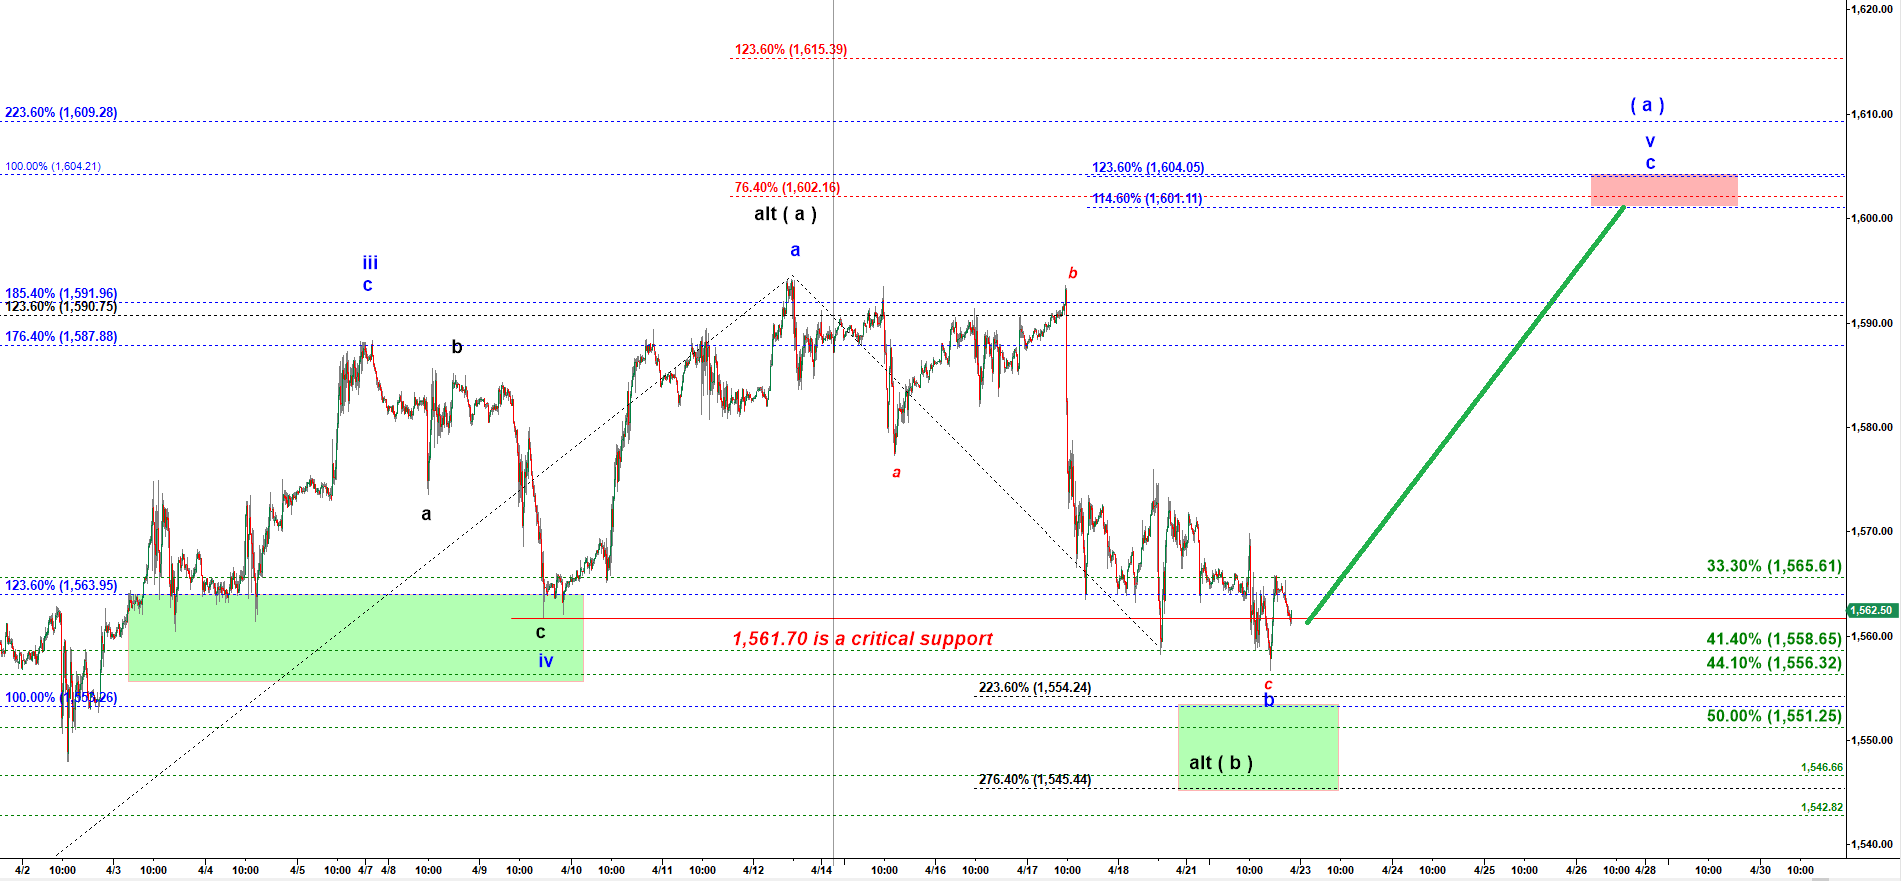
RTY - 45 min chart updated at 9:45 PM on 4/22/2019
Yesterday, as you can see on the updated chart below, we got an impressive almost vertical move following that expected green path. That is wave c of v of ( a ) of ( v ). It still can move a bit higher to exceed the previous top made by wave a of v ( 1,594.20 reached on 12 Apr 2019 ). At this point I would wait for a corrective a-b-c down in wave ( b ) down of ( v ) up. It is barely possible to predict how deep that ( b ) down may get. We will be watching a corrective (a)-(b)-(c) down structure tagging one of the common retracement levels: 50%, 61.8% or 76.4%. Those retracement ratios have to be applied to a rally started off the 1,497.40 low made on 25 March 2019.
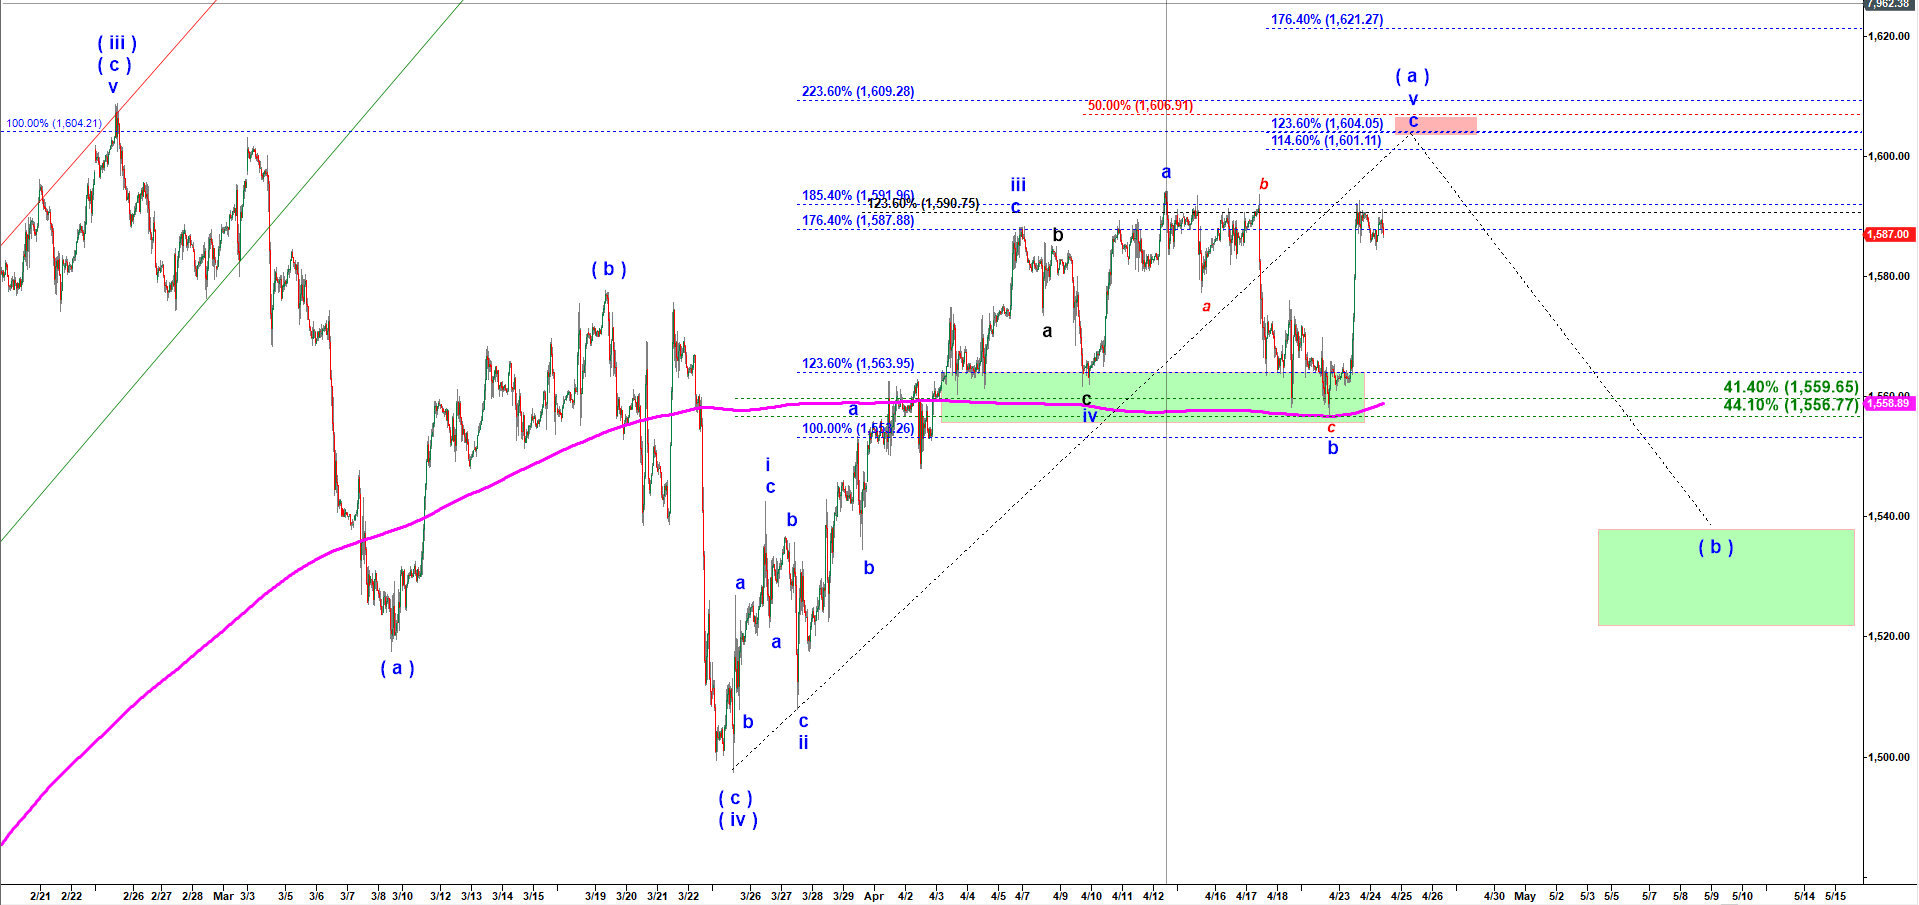
RTY - 45 min chart updated at 9:13 AM on 4/24/2019