Subscription: Micro Counts of Crude Oil & Nat Gas
Crude Oil - still keeps both scenarios at the table
In the previous report posted this morning I outlined two scenarios:
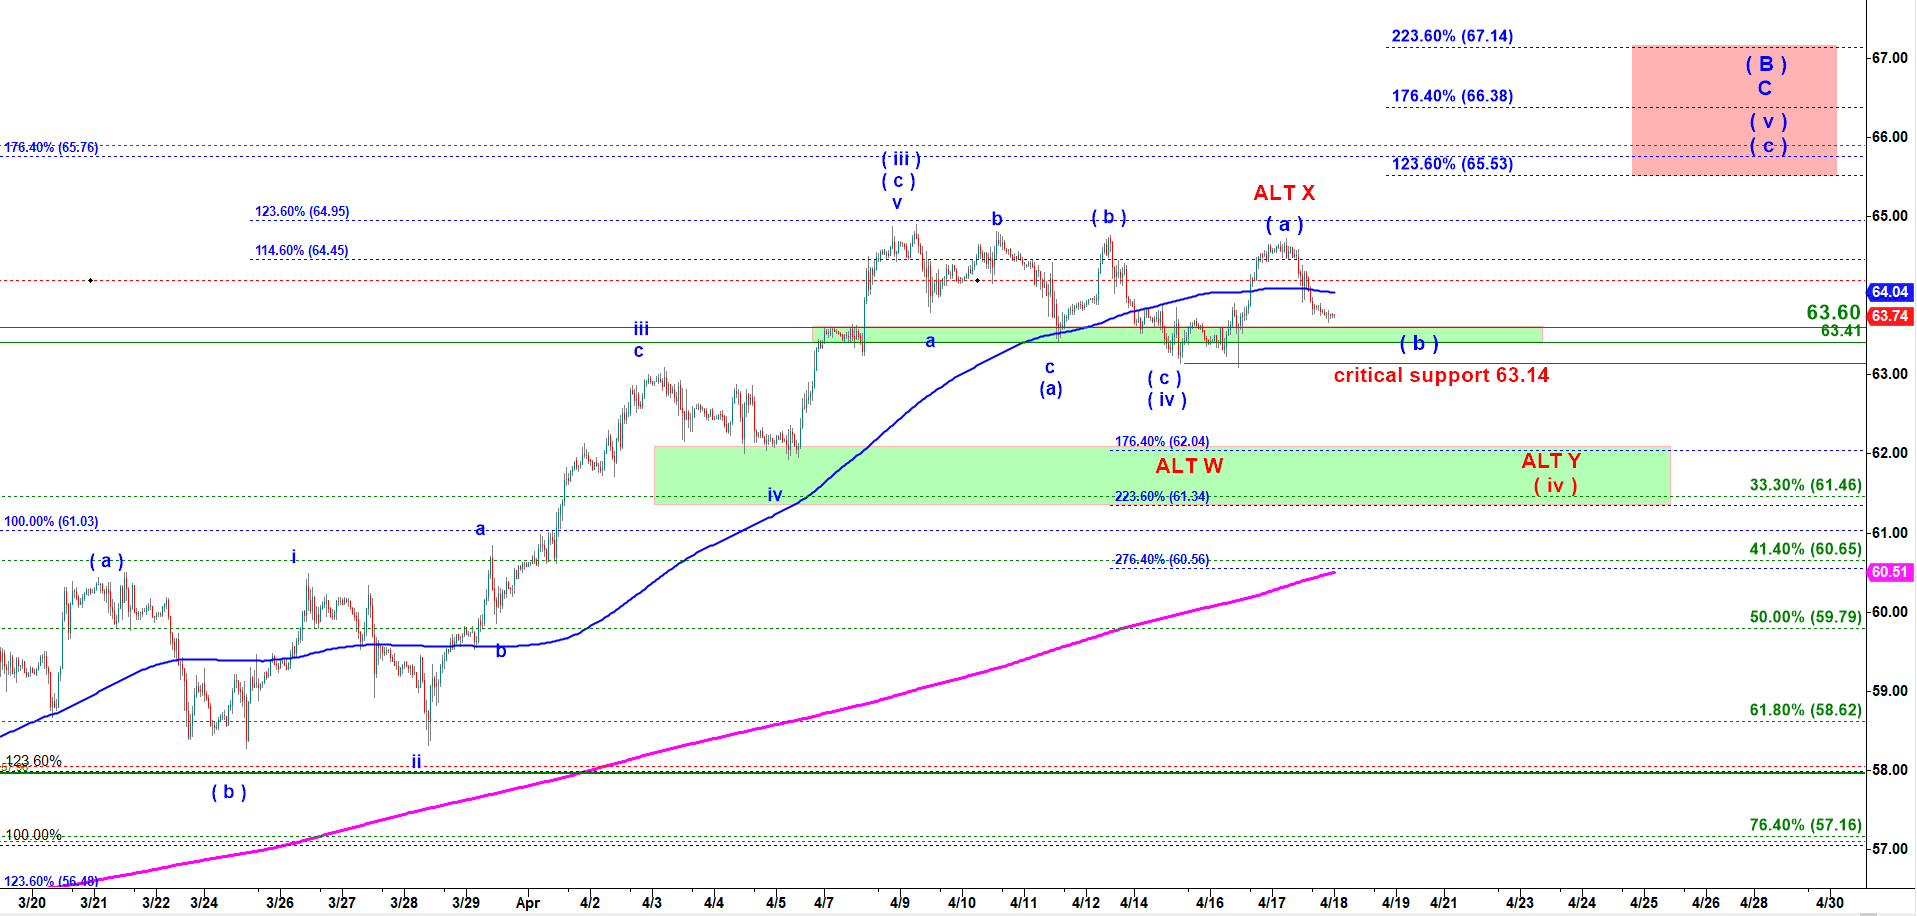
“The first scenario is that the previous pullback structured as (a)-(b)-(c) was a completed wave ( iv ) down ( the blue count). Then the retest of the top of the previous wave ( iii ) up is a textbook wave ( a ) of ( v ) that has to be followed by a pullback in ( b ) down. And after that we will get the final push higher in the wave ( c ) of ( v ) of C of ( B ) up completing a large rally started in December 2018.
The second scenario is that the previous pullback structured as (a)-(b)-(c) was NOT a completed wave ( iv ) down but rather first leg down in wave W (see the red ALT count). Then this retest of the previous top is a corrective wave X up. And from here we may get another (a)-(b)-(c) structure down that would complete a corrective wave (iv ) down structured as a complex double three structure.”
Under the both scenarios Crude was supposed to get rejected from the previous top. This is exactly what happened. Crude is approaching an ideal support zone for wave ( b ) down. But the structure of that decline does not look corrective. That is an argument in favor of the red alternative bearish scenario. Under that scenario this decline is wave a down of the second pair of a-b-c comprising the final red wave Y. That wave Y may drop to 62.00-61.50
Crude Oil - 45 min chart updated at 11:30 PM on 4/17/2019