Skip to content
  • Home
  • US Market Updates
  • Indicators
    • Impulse Master
    • Cycle Trader
    • GANN Levels
    • Subscribe
  • Education
    • Beginners Video Course
    • Intermediate Video Course
      • Syllabus of the Course
    • Trading Like A Pro Video Course
    • Video Lesson of the Week
  • Chat Room
  • Pricing
  • FAQ
  • My Account
  • Login

Subscription: Access to Micro Counts of US indices

RTY might have started a corrective wave ( b ) down

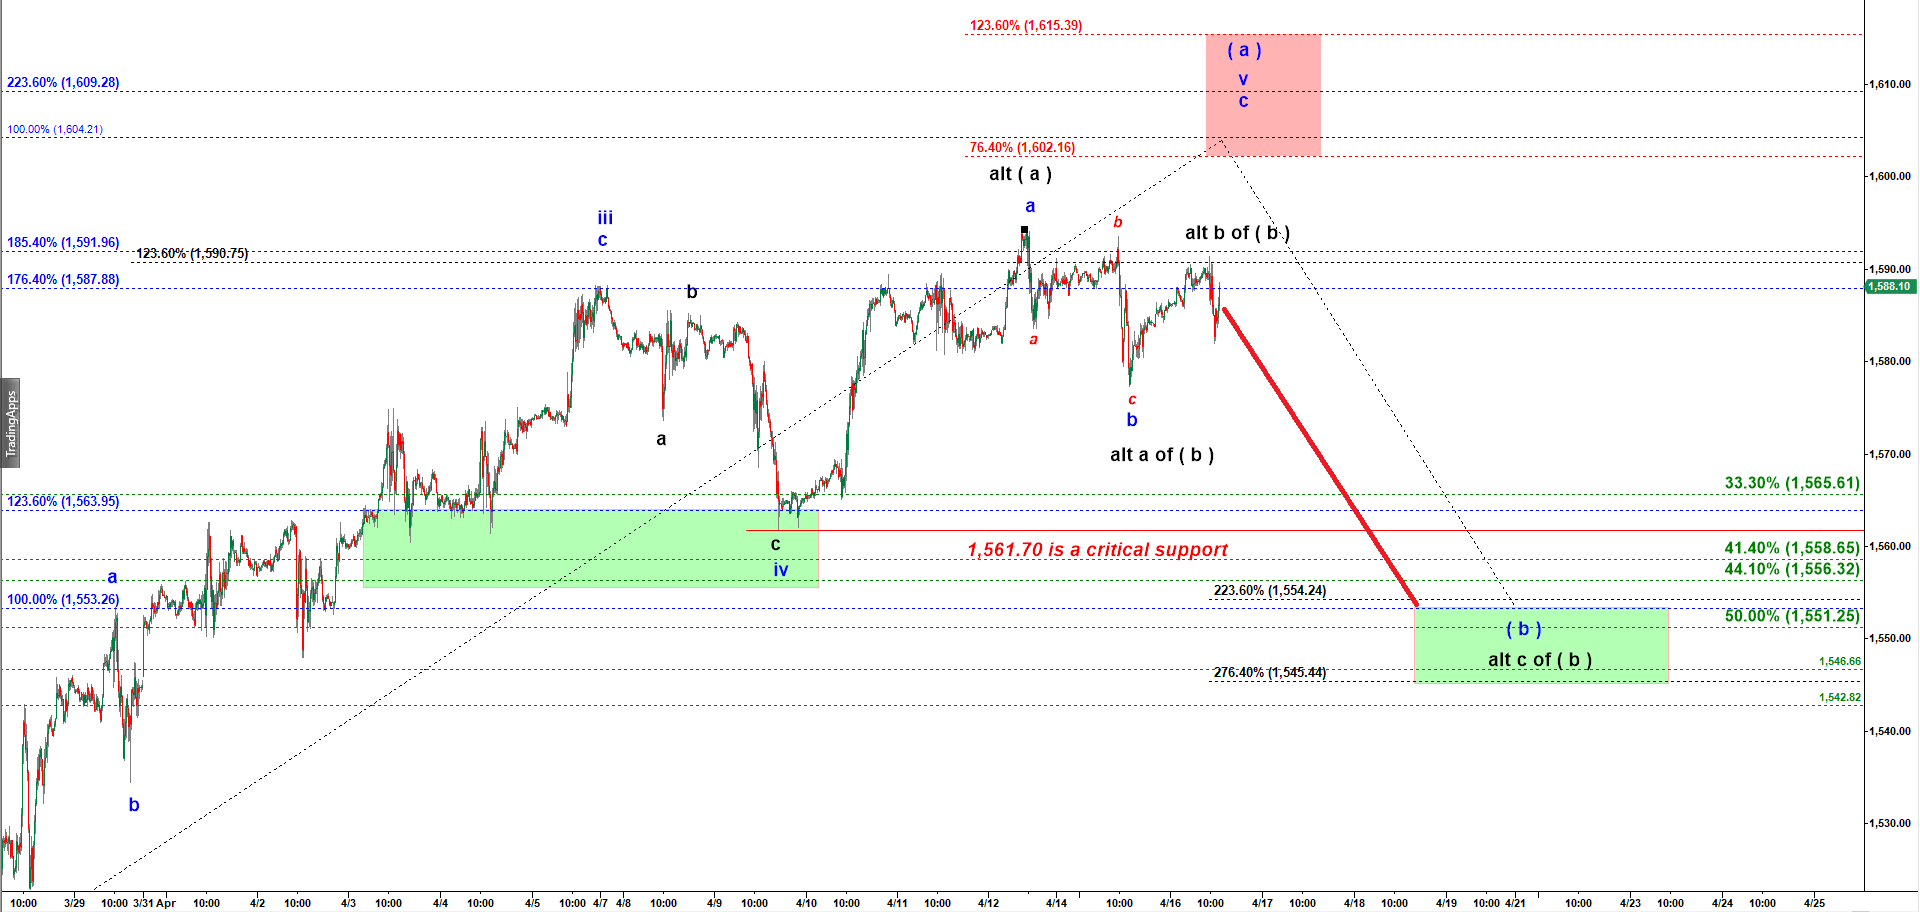
It is a bearish sign that Russell has made two lower highs while his siblings S&P and Nasdaq have made higher highs and approached their targets. That makes me introduce you a slightly count where RTY has topped in wave ( a ) of ( v ) and has started a corrective decline in wave ( b ) down. Under that scenario it shall drop to 1,560-1,550. That scenario will not be valid if RTY climbs over 1,595

RTY - 15 min chart updated at 12:10 PM on 4/16/2019

Previous posts:

No posts found.
© 2025 CastAway Trader • Built with GeneratePress