Subscription: Micro Counts of Crude Oil & Nat Gas
Crude Oil in no-man's land
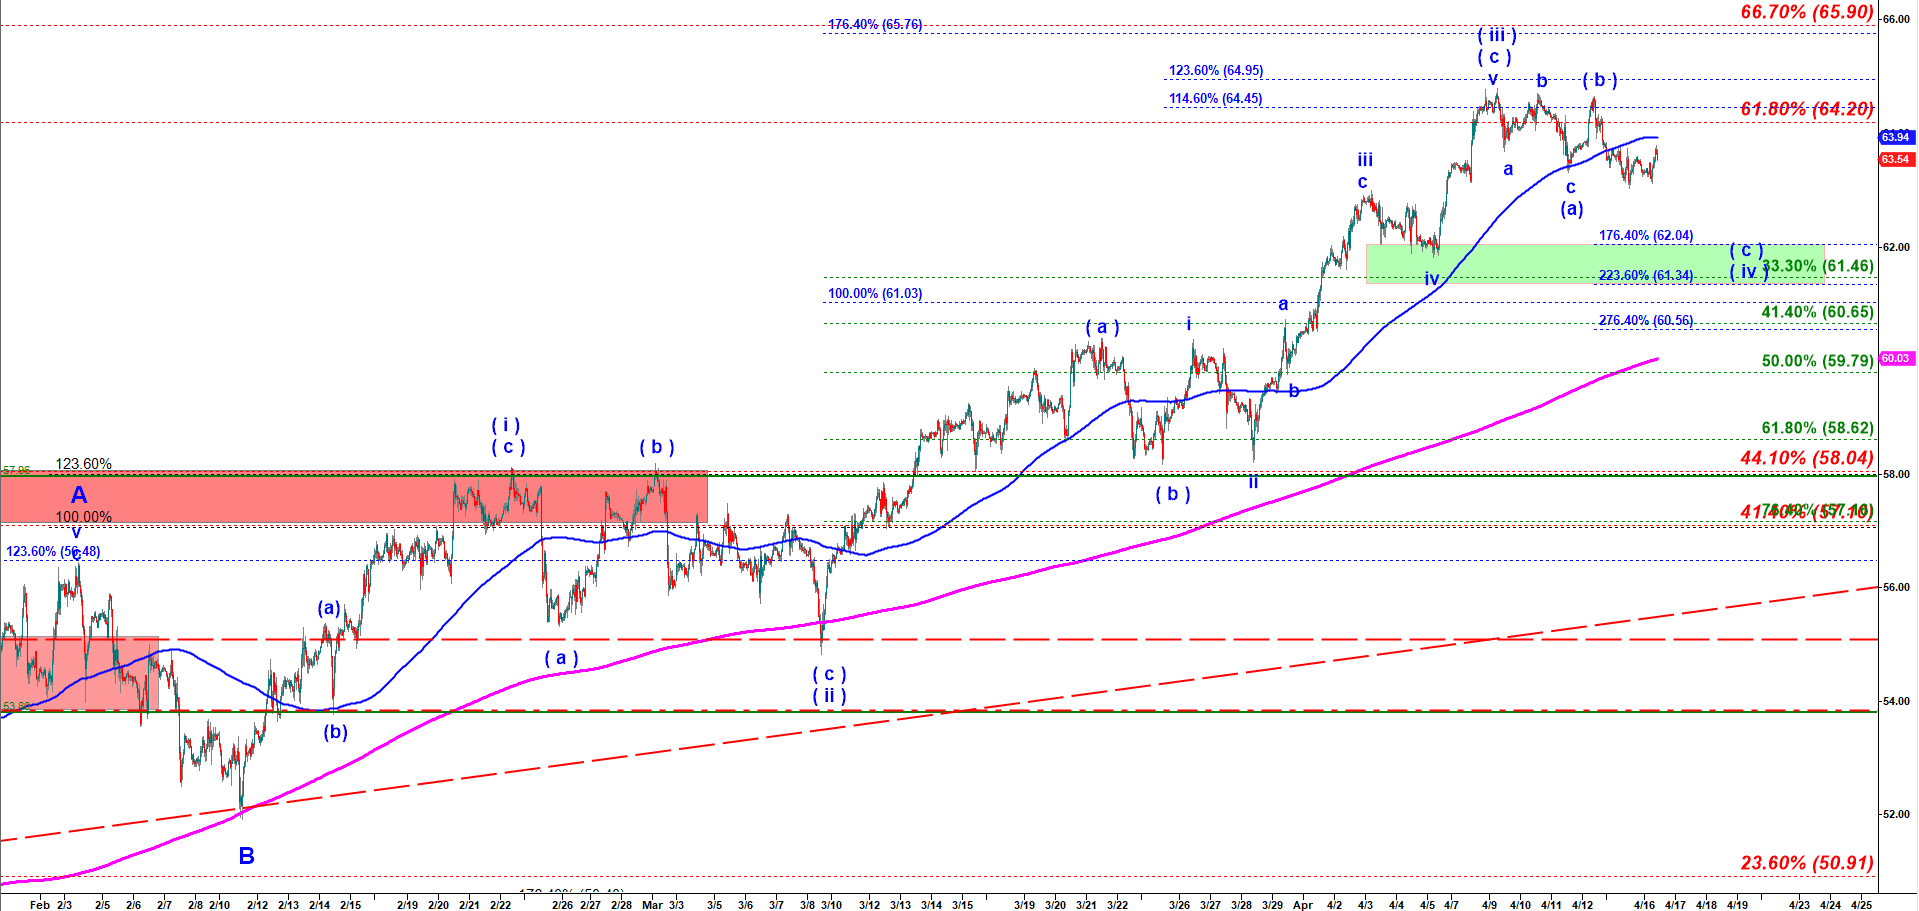
It is not clear whether that (a)-(b)-(c) down structure was all of the wave ( iv ) down. Despite the fact it did not get to my green target box it may be enough for wave ( iv ) down of that degree. Another less probable option is that we may get a more complex correction when this move up will make a lower high in a wave X and then another (a)-(b)-(c) down will unfold completing wave Y of a double three corrective structure also called “combination“.
If that ( iv ) down has bottomed it may play wave ( v ) up targeting a new higher high and completing the whole rally started in December 2018. Because that rally is structured as a corrective A-B-C up I expect a strong drop after completion of that wave ( v ) of C up. That C up will complete a corrective wave ( B ) up of ( 5 ) down. The wave ( C ) of ( 5 ) down may target a new lower low under the lows reached in Feb 2016.
Crude Oil - 45 min chart updated at 9:26 AM on 4/16/2019