Skip to content
  • Home
  • US Market Updates
  • Indicators
    • Impulse Master
    • Cycle Trader
    • GANN Levels
    • Subscribe
  • Education
    • Beginners Video Course
    • Intermediate Video Course
      • Syllabus of the Course
    • Trading Like A Pro Video Course
    • Video Lesson of the Week
  • Chat Room
  • Pricing
  • FAQ
  • My Account
  • Login

Subscription: Access to Micro Counts of US indices

RTY keeps grinding higher towards the red box

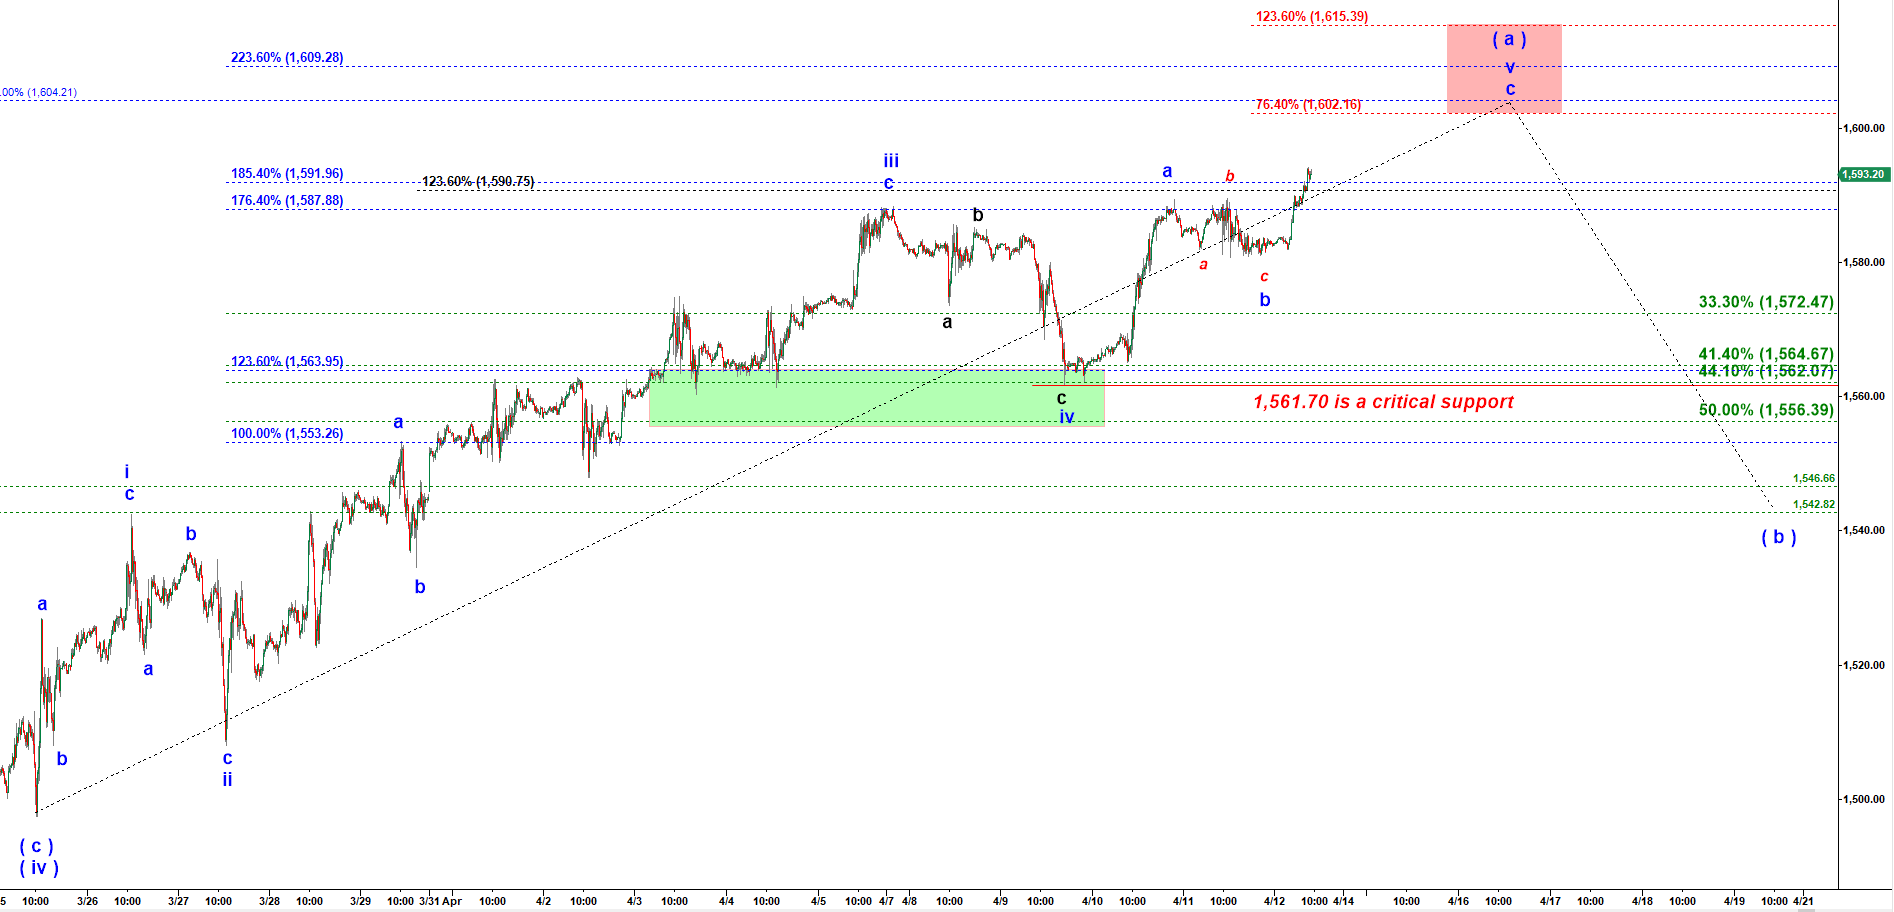
As expected, RTY found support in the green target box and then rallied to retest the previous top made my preceding rally in wave iii up.That was a classic wave a of v targeting the previous top. Then we got a shallow correction in wave b down and started the final rally in wave c up. There are four common target levels for wave c as extension of wave of a of v: 76.4% (weak one), 123.6% (normal case), 176.4% (bullish case), 223.6% (extreme blow off top case).

RTY - 15 min chart updated at 9:03 AM on 4/12/2019

9:03 AM

Previous posts:

No posts found.
© 2025 CastAway Trader • Built with GeneratePress