
Subscription: Value Stocks
ABBV is a great company but the stock does not look having bottomed
AbbVie Inc. (AbbVie) is a research-based biopharmaceutical company. The Company is engaged in the discovery, development, manufacture and sale of a range of pharmaceutical products.
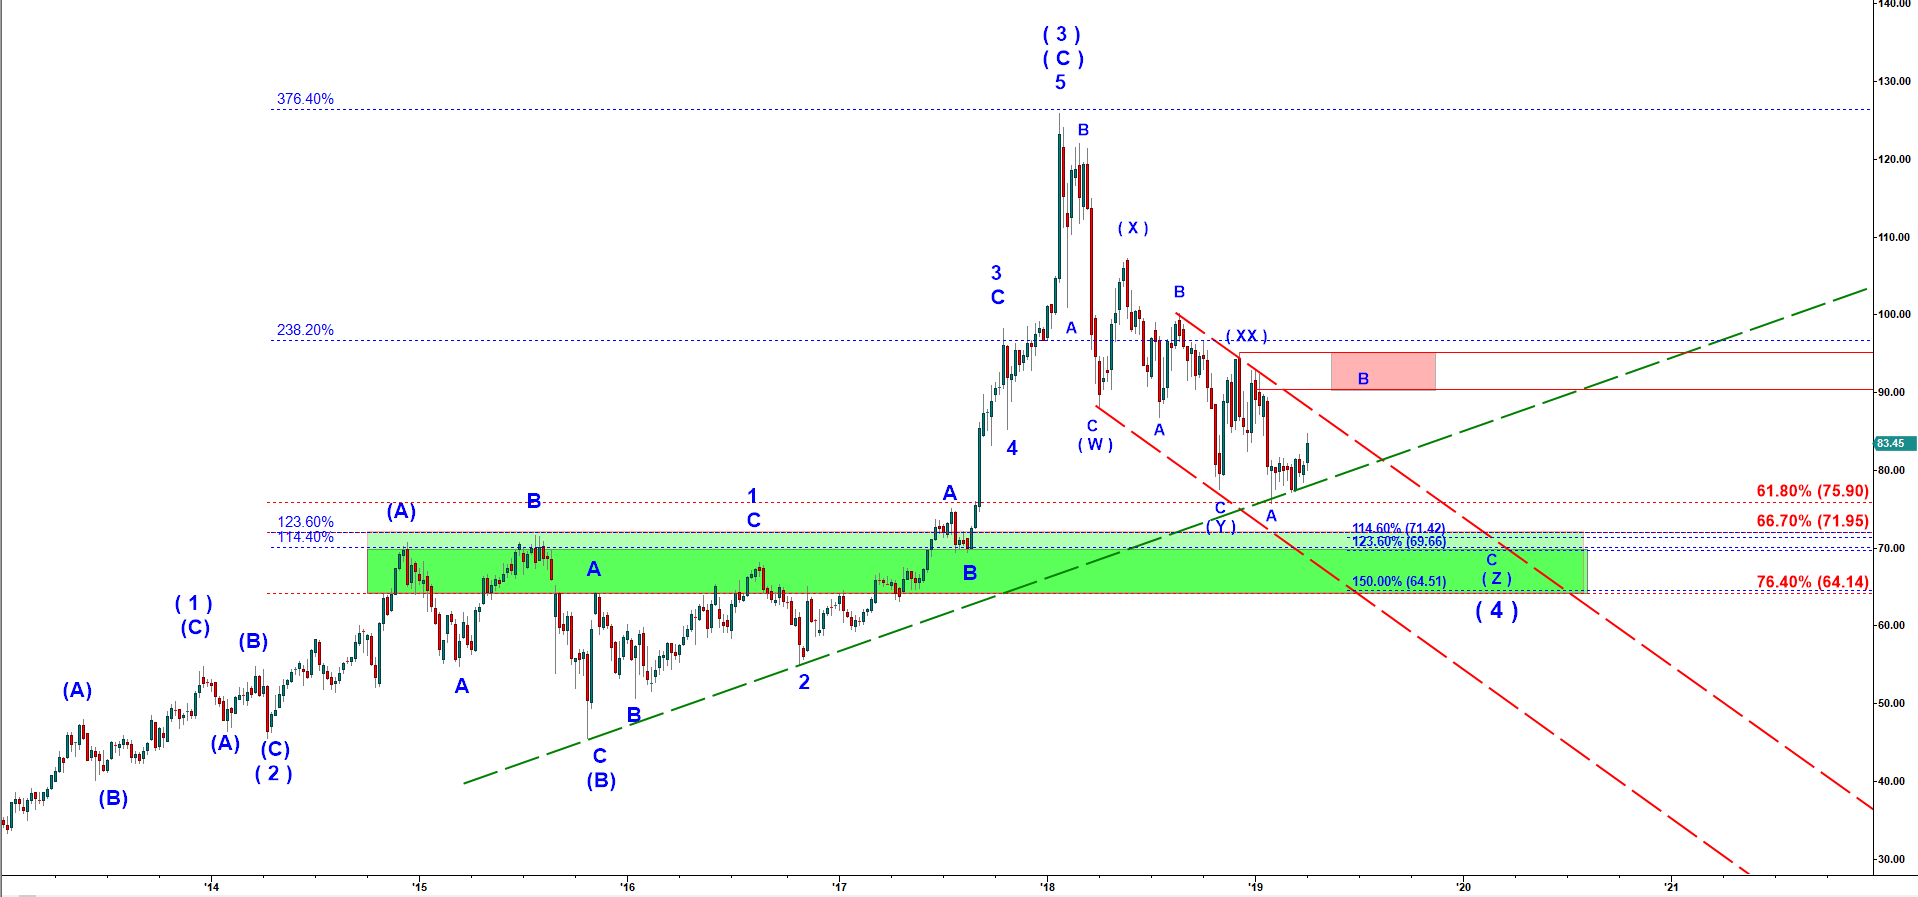
I count the top made by ABBV at $125.86 in January 2018 as the top of the wave ( 3 ) up, the strongest part of the rally. In full accordance to the Five Wave Up fractal, a corrective looking decline followed. That wave ( 4 ) down is shaped as so called “triple three”. This is a complex correction that is combined of three A-B-C structures. It had great chances to bottom at $77.50 in November 2018. Back then it completed two A-B-C structures. However a new lower low (75.77) made in February 2019 killed that possibility. That drop should be counted as the first leg down in wave A of the third A-B-C structure. That implies the move up we are getting now is only a corrective pullback in wave B up and that bounce should be followed bu another impulsive looking drop in wave C down.
If we apply Fibonacci retracement ratios to completed rally in wave ( 3 ) up we may get tow important levels: $71.95 (61.8%) and $64.14 (76.4%). As soon as that corrective rally in wave B up is completed we will be able to apply extensions of the wave A down from the top of that wave B to make more precise estimations of the potential bottom of the wave C down.
ABBV - Weekly chart updated on 4/6/2019
Financial Strength
The company has great profitability ratios but is has a large debt. Debt is considered normal when it does not exceed EBITDA by more that x 2.5 times. ABBV has DEBT exceeding EBITDA by x 4.9 times! It is traded with a favorable valuation with Price-to-Free-Cash-Flow at x 10.
Operating Margin
19%
Net
Margin
17%
Return on Capital
208%
Price-to-Free-Cash-Flow
x 10
Debt-to-EBITDA
x 4.9
Dividend
Yield
4.7%