$SPX #SPX #trading setup #Elliott Wave #macro #weekly
The Bullish scenario assumes that S&P made a bottom of a corrective wave ( 4 ) in October 2022.
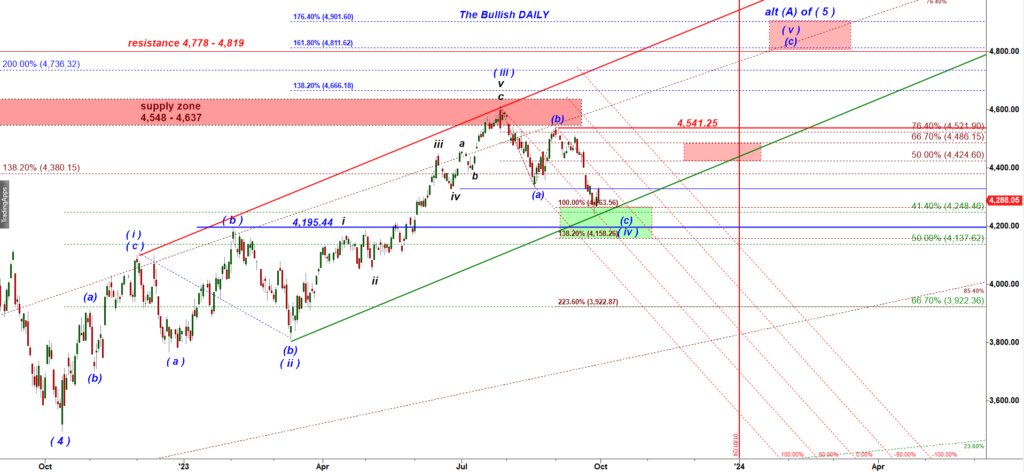
Then the move up off the Oct’22 low it has been moving up in an impulsive wave (A) of (5) that targets to re-test the all-time high made in Jan’22.
The main uncertainty is whether the second leg down off the July’23, the subwave (c) of wave (iv) down bottomed last week. Because wave (iii) up topped slightly under the weak 138.2% ext of the wave (i) up it spells weak bullish momentum. Normally when wave (iii) up tops slightly under 138.2% ext the final wave (v) up tops either at 161.8% ext or 176.4% ext of the wave (i) up (see the red box in the upper red box in between of 4,811 and 4,901).
Another guidance is when a weak wave (iii) down tops under 138,2% ext the corrective wave (iv) down may go deep enough to tag the top of the preceding move up (4,195.44). Touching the previous top normally re-energizes bulls, runs protective stops left by perm-bulls and is followed by a new leg up.
So we can not exclude possibility that we will get one more push lower under 4,200 before bulls attempt to start a new leg up:
This how that play out providing us with our favorite bullish reversal setup, the Inverse Head and Shoulders pattern:
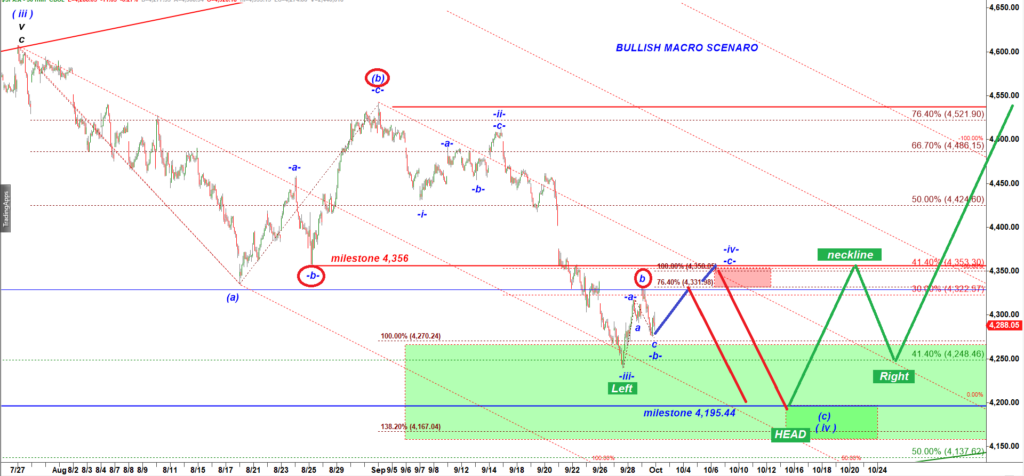
So I want you to keep special attention to all tops and bottoms made by any wave b.
In the part I of this macro update I explained that:
tops and bottoms of previously completed waves B or subwave “b” almost always work as important support and resistance levels.
I will be calling those important pivots “the milestones”.
That easy to apply approach turns your wave count into a web of potential high probability reversal zones. If we happen to get another push higher (as we expected at Friday close) then there will be two potential reversal levels both defined by previously completed subwaves b:
(i) the subwave b up (the Friday morning top) = 4,333, and
(ii) the subwave -b- down bottomed at 4,356 on Aug 25th.
Those two potential reversal zone defined my red box, a potential target for topping in a subwave -c- of wave -iv- up.
The ideal scenario would be to get another push into that red box followed by rejection and another drop down to another milestone = 4,195.44!
Note, such a drop would complete the Head of tpe Inverse Head and Shoulders pattern.
Finally, I want to come back to the bullish daily chart:
Every clean bullish setup is just an opportunity for bulls.
Its like a door that provides access to a specific path in a world where numerous alternative scenarios of the future exist. Nobody knows the future. The market does not knows its future.
When we get an attractive scenario a large number of traders notice it and bet money on it.
But in 40%-50% of cases a promising move coming off a good looking scenario fails and makes a turn that opens a door activating a different alternative path.
When we get a clean a-b-c move down into a demand zone more often that not it is followed by a rally.
But I personally never hold long position expecting the best possible scenario to play out.
I always sell early. And it makes me depressed for years until I realized that is my style of trading. I would rather make more trades making less on each of them but avoid very painful reversals.
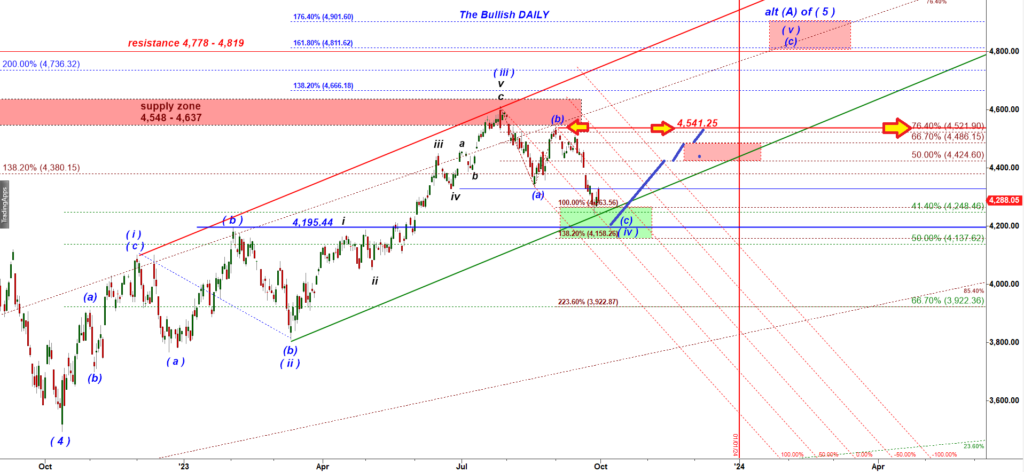
So that drop down to 4,200 or slightly lower would most likely attract a lot of fresh money and push S&P back up at least to test the lower red box that we can call “the risk zone”.
This is where people like me will be selling our long positions.
The bullish scenario provides bulls with a setup to start a new (a)- up, (b) down, () up structure targeting the all time high made in Jan 22.
But at this moment its totally impossible to predict whether bulls will be able to break over the lower red box and realize the potential of that bullish scenario or they stumble upon that lower red box.
Remember, if we get a strong push higher without clean structure pushing price back up strongly into the Red Box MOST LIKELY that would rather mean we deal with a false start, with a failed premature attempt of a rally that would turn into a wave (x) up inside the double three scenario.
I keep repeating two rules I learned the hard way after making tens of thousand of trades:
(i) big rallies start in a slow to unfold way: “price first crawls, then walks, then runs” and
(ii) I never trust spiky moves. In majority of cases strong spiky moves that lack internal structure fails and turns into corrective waves x.
Do you see that those two rules actually complement each other?
In conclusion:
The ideal scenario will be to get another drop down slightly under 4,200 for S&P cash index. Then we should get a move up at the very least to 4,401 to fill the opened gap down left on Sep 21.
The bearish scenario (explained in the Part I of this Macro Update) argues that the move up off the 4,200 to 4,400 – 4,470 will fail and we will start a new large leg down targeting 3,800.
Alternatively, the bullish scenario argues that bulls will be able to get over 4,400 – 4,470 resistance and will continue pushing higher up 4,778 – 4,819, to retest the Jan’22 highs.
Th good thing is that both scenarios allow bulls to push higher to complete a corrective wave -iv down and then push down in a micro wave v down under 4,200. And both scenarios allow bulls to start a rally off the 4,200 support level.